

Controls
Motion Analysis has a number of simple menu-selected control functions that set up the correct video parameters, set scaling indices, select the digitization mode, and let you display or save the results. Most of these options are found in the DIGITIZE menu.
- Spatial scaling
- Distance measurement
- Segment cues
- Trajectory plotting
- Frame rates and frame advancement
- Plotting results

![]() The Image spatial scaling routine tells the program how to convert from pixel coordinates into the appropriate spatial units. It does this by determining the length in pixels of a target of known dimensions within the video image. You click on each end of the target image (the program prompts you to do this; sometimes you need to click twice on the first point). Then you enter the actual dimension of the target in the topmost edit field and (if this is different from the default value of 10) click the 'recalculate' button. You can then tell the program to accept the new conversion factor, keep the old one, recalculate again (based on a new target dimension), or reselect the target coordinates.
The Image spatial scaling routine tells the program how to convert from pixel coordinates into the appropriate spatial units. It does this by determining the length in pixels of a target of known dimensions within the video image. You click on each end of the target image (the program prompts you to do this; sometimes you need to click twice on the first point). Then you enter the actual dimension of the target in the topmost edit field and (if this is different from the default value of 10) click the 'recalculate' button. You can then tell the program to accept the new conversion factor, keep the old one, recalculate again (based on a new target dimension), or reselect the target coordinates.
The example at right ('Set scale' window) shows a calculation of 53.3 pixels per cm, based on an image of a 10 cm scale bar.
| NOTE: at present, Motion Analysis does not account for distortions in the image; in other words it assumes the spatial conversion factor in the vertical direction is the same as for the horizontal direction. Therefore, you need to make sure that you don't have parallax errors or significant lens distortions in your movies. |
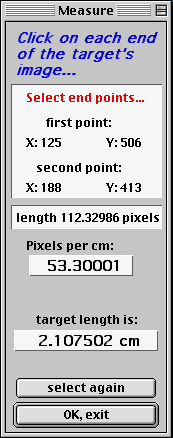
![]() The Measure distance routine lets you measure the length (in your chosen distance units) of a target in the video image. You click on each end of the target, and its length is computed from the pixel conversion factor determined in the spatial scaling routine (if this has not been done before you select the distance measure routine, spatial scaling is run first).
The Measure distance routine lets you measure the length (in your chosen distance units) of a target in the video image. You click on each end of the target, and its length is computed from the pixel conversion factor determined in the spatial scaling routine (if this has not been done before you select the distance measure routine, spatial scaling is run first).
The example at right ('Measure' window) shows a calculation of a target length of 2.107 cm, based on a previously-computed vaue of53.3 pixels per cm.
| NOTE: at present, Motion Analysis only measures distances in straight lines. You cannot measure the length of a target in a series of segments (i.e., if the target is curved). This may be implemented in future releases. |
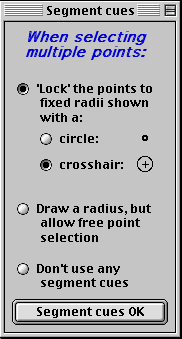
![]() When you are digitizing more than one point per frame, you can select several segment cue modes to help you select sequential points in a frame. Segment cues can help you consistently select sequential points. For example, if you are tracking different positions on an object (like the nose, midbody, and tail of an animal), you might want to place the 'midbody' and 'tail' points a fixed distance away from the previous point -- the midbody might be a fixed distance from the nose, and the tail is another fixed distance from the midbody. You have the option of 'locking' sequental points to fixed radii around the previous point, or drawing radii on the screen but allowing free point selection, or using no segment cues at all.
When you are digitizing more than one point per frame, you can select several segment cue modes to help you select sequential points in a frame. Segment cues can help you consistently select sequential points. For example, if you are tracking different positions on an object (like the nose, midbody, and tail of an animal), you might want to place the 'midbody' and 'tail' points a fixed distance away from the previous point -- the midbody might be a fixed distance from the nose, and the tail is another fixed distance from the midbody. You have the option of 'locking' sequental points to fixed radii around the previous point, or drawing radii on the screen but allowing free point selection, or using no segment cues at all.
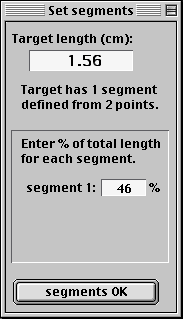
NOTE: Specifying segment lengths is done in the points per frame window. After you select more than one points per frame, you are asked to specify the actual length of the object (the program converts this to pixels based on the scaling parameters obtained from the image spatial scaling routine). You then indicate the length of each segment as a percentage of total length (your segments can be longer than object length, if desired).
If you select the 'locking' option, you can pick either a small circle or a cross-hair as the indicator of the point position ('Segment cues' window, above).
The other sample window ('Set segments') shows selection of a single segment totalling 46% of the target's total length of 1.56 cm.
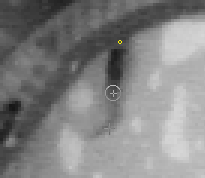
The picture immediately at right shows the segment position indication (circled cross-hairs) 'locked' at a fixed radius from the intial point (small yellow circle). The cursor is faintly bisible below the segment position indicator. As the cursor is moved around the screen, the computer keeps the segment indictor located at a constant distance from the initial point, along a line from the initial point to the current cursor position.
In this example, the image is of a small fish in the middle of a startle response (filmed at 500 frames per second with a high-speed video camera).
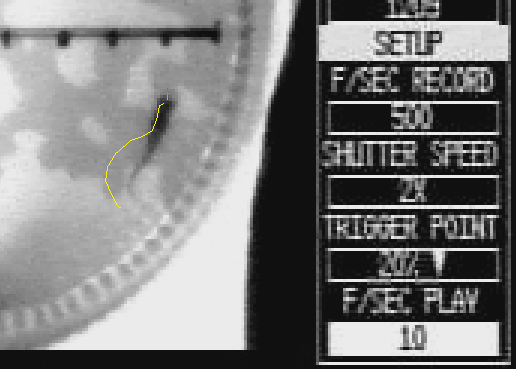
![]() Trajectory plotting draws a record of previously digitized points on the video image (only the initial point per frame is shown, even if you are digitizing more than one point per frame). Trajectory plotting provides a useful record of how the target has moved during the event and sometimes can help you determine where the next point should be. However, it can clutter up and obscure the image. Accordingly, you can select from a number of options, including no trajectory plotting (the default), plotting initial position only, plotting initial and last position, plotting the last 5 or 10 positions, plotting all but the last 5 positions, or plotting all previous positions.
Trajectory plotting draws a record of previously digitized points on the video image (only the initial point per frame is shown, even if you are digitizing more than one point per frame). Trajectory plotting provides a useful record of how the target has moved during the event and sometimes can help you determine where the next point should be. However, it can clutter up and obscure the image. Accordingly, you can select from a number of options, including no trajectory plotting (the default), plotting initial position only, plotting initial and last position, plotting the last 5 or 10 positions, plotting all but the last 5 positions, or plotting all previous positions.
You can select from plotting trajectories as points (indicated by small circles) or a line. Colors for the trajectory plot are chosen in the 'preferences' window (FILE menu).
The example (right) shows the trajectory of the nose of a small fish during an escape response, indicated b the yellow line (the next point, indicated by the faint cross-hair, has yet to be selected). Filmed at 500 frames/second with a high-speed video camera.
![]() Frame advancing specifies how many frames forward the movie is 'stepped' when you have finished digitizing all the points in a frame. The default value is one (i.e., frame-by-frame advancing) but you can select increments of 2, 3, 4, 5, 6, or 10 frames.
Frame advancing specifies how many frames forward the movie is 'stepped' when you have finished digitizing all the points in a frame. The default value is one (i.e., frame-by-frame advancing) but you can select increments of 2, 3, 4, 5, 6, or 10 frames.
Keyboard commands (command-f, or simply hitting the 'f' key) will advance the movie one frame at a time.
![]() Frame rates (the number of frames per second) tells the program how fast the camera was working. This information is needed to compute elapsed times, velocities, etc. The default is 500 frames/second, but you can select any value.
Frame rates (the number of frames per second) tells the program how fast the camera was working. This information is needed to compute elapsed times, velocities, etc. The default is 500 frames/second, but you can select any value.
Make sure the frame rate used by Motion Analysis matches the frame rate when the movie was made, or all acceleration and velocity data will be in error.
![]() The Show results window (
The Show results window (![]() -P) draws plots of velocity (instantaneous or net), distance (from the intial point in the event), or position (referenced to the starting position in the event sequence). If more than one point per frame was digitized (even for only a subset of the event), you can select which points to plot. The example below shows instantaneous velocities (solid blue line), calculated from the elapsed time between frames and the distance moved between frames. It also shows the net velocity (dashed line), calculated from the elapsed time between the start of the event and the time of each point) and the net distance moved from the start of the event.
-P) draws plots of velocity (instantaneous or net), distance (from the intial point in the event), or position (referenced to the starting position in the event sequence). If more than one point per frame was digitized (even for only a subset of the event), you can select which points to plot. The example below shows instantaneous velocities (solid blue line), calculated from the elapsed time between frames and the distance moved between frames. It also shows the net velocity (dashed line), calculated from the elapsed time between the start of the event and the time of each point) and the net distance moved from the start of the event.
The smooth option performs 3-point nearest-neighbor smoothing on instantaneous velocity plots (you may have to click the 'velocity' or 'instant' buttons to see this effect). Smoothing does not affect the stored data.
The following example shows the raw position data, with the coordinate 0, 0 defined as the position at the start of the event (this shows a plot where only one point per frame was digitized; if more than one point per frame is digitized, lines of other colors are used in addition to the blue line for the initial point).
![]() Sometimes the net velocity index is inaccurate because the movement being analyzed did not start with the first frame in the digitizing sequence. You can use the Recompute net velocity option (part of the Show results window) to recompute net velocity based on a frame other than the first in the event sequence. Typically this produces an increase in net velocity (the effect is greater on the early part of the sequence than for the later portions).
Sometimes the net velocity index is inaccurate because the movement being analyzed did not start with the first frame in the digitizing sequence. You can use the Recompute net velocity option (part of the Show results window) to recompute net velocity based on a frame other than the first in the event sequence. Typically this produces an increase in net velocity (the effect is greater on the early part of the sequence than for the later portions).
back to the main Motion Analysis page