Analysis utilities  This
submenu has four items: This
submenu has four items:
AUTOREPEAT ⌘R Toggles the auto-repetition feature
for analysis modes. When active, autorepeat mode repeats the last
analysis used whenever a new block is selected. If you want to do
something different, just pick the new analysis from the menu or from the
buttons below the plot area.

BLOCK WIDTH...
Allows automatic selection of
blocks of user-defined duration with a single mouse click, instead of the
normal method of clicking on both the start and end of the desired block (or clicking and dragging).
In this mode, the cursor is contained within a box that 'frames' the block
duration in the plot area. Position the cursor over the desired block
and click once to select it.
The default automatic block size is equivalent to 13 samples or 12 sample
intervals (e.g., 60 seconds with a 5-second sample interval). Any
other block size can be selected, as long as it contains more than 2 samples
and less than 1/4 of the file duration. In this example, a 5-minute block duration (300 seconds) has been selected.
Return to the standard two-click selection method with the 'Normal
block selection' button.
SCALE RESULTS... Opens
a window for entry of scaling factors that can be selectively applied to
the results of several analysis operations with the 'scale' button
(in the RESULTS window). These factors take the form:
final value = (result x B) +A or final value = (result ÷
B) +A
 Different A and B values can be
applied to each channel, but you must enter the correct values in any channel
you wish to scale (in other words, if you have scaling factors entered
for channel 5, they apply only to channel 5 unless they are also
entered in another channel of interest). Different A and B values can be
applied to each channel, but you must enter the correct values in any channel
you wish to scale (in other words, if you have scaling factors entered
for channel 5, they apply only to channel 5 unless they are also
entered in another channel of interest).
This example shows:
- addition of .74 to channel 1
- multiplication of channel 3 by 0.140479, and addition of .002 to the
result.
- division of channel 5 by 2.
- no change to the other channels.
The 'Store' button in many
of the analysis mode windows allows you to directly transfer the current
results mean for use as a scaling factor. When you click the Store
button, the scaling factors window appears. Click on any channel's
"*" or "÷" button, and the current mean will
appear in the first edit field (the multiplication or division factor)
for that channel.
CROSS-CHANNEL SUBSET SELECTION  Use this option to restrict analysis according to specific ranges or values of data in another channel. In the example shown here, data during the night are ignored (i.e., times between 18:00 and 06:00), as are data where temperature (Ta) is hotter than 65 or colder than 0.5. It is not used in the example, but restricting to single values is possble (using the '=' option), but this is very restrictive and is probably best suited to boolean data (zero or one, for example).
If you use this option, make sure your restrictions leave SOME data available for analysis -- this is especially important if you are setting restrictions on more than one channel. 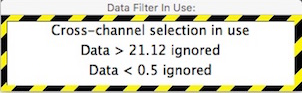 If you use cross-channel subsets, a warning window will appear for analyses that 'pay attention' to subset settings. This example shows cross-channel selection is being used, and within the channel being analyzed, data with values less than 0.5 or greater than 21.12 are ignored.
DON'T USE INTERPOLATED DATA
If this option is selected, the AVERAGE,
MINIMUM VALUE, MAXIMUM VALUE, MOST LEVEL, MOST
VARIABLE, SLOPE OVER TIME, and REGRESSION operations will
not use interpolated data when scanning for desired values. Note that it
does not matter which channel was interpolated: if this option is
selected all data from any channel within interpolation boundaries
will be rejected. Note that interpolation is determined from the standard
interpolation markers: "»" indicates the start of interpolation
and "«" indicates the end of interpolation. These are optionally
set automatically in the Remove references and Interactive spike
removal operations, or you can insert them manually from the 'markers'
submenu in the VIEW menu.
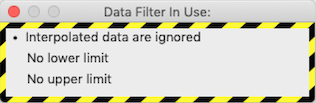 If you have selected this option and an
analysis operation encounters interpolated data within the regions selected
for analysis, this warning window is shown: If you have selected this option and an
analysis operation encounters interpolated data within the regions selected
for analysis, this warning window is shown:
You will also notice that the number of cases shown in the 'Results'
window is less than shown in the 'Block' window. The difference is the
number of interpolated data points that were ignored during analysis.
BLOCK SHIFT LEFT << ⌘< If there is room in the plot area, this will shift the block to the left (i.e., towards earlier events) by one blockwidth of data points.
BLOCK SHIFT RIGHT >> ⌘> If there is room in the plot area, this will shift the block to the right (i.e., towards later events) by one blockwidth of data points.
BLOCK SHIFT RULES This opens a small window that lets you select how the shift block operations work: with or without overlap of one case. For example, if your block contains cases 200-400 and you shift it right with overlap, the new block will contain cases 400-600. If you use the default non-overlap option, the new block will contain cases 401-601.
|
