Thermoregulatory costs estimates

  •    THERMOREGULATORY COSTS…      This specialized calculator, of interest mainly to thermal physiologists, uses weather (temperature) data from a loaded file to estimate the energy cost of thermoregulation for an endotherm:   e.g., bird or mammal.   The calculations produce a mean cost of thermoregulation, plus several related values, over whatever period the weather data encompass.

    Important cautions:
    1. For temperature data, the program's default 'assumption' is that a value of zero = bad data (or no data).  If your temperatures include real values of zero, then use .001 (or some other small but non-zero number) instead of zero.

    2. The program will attempt to find the highest 6 and 12-h readings, so the implicit assumption is that your climate data are sampled at least once per hour (higher sampling rates are OK).


    Thermoregulatory costs are calculated using the following thermal parameters:   body temperature (Tb), lower critical temperature (LCT), thermal conductance (Cth; watts/°C), and basal metabolic rate (BMR; ml O2/min or watts; selected in the 'options' window) in a set of edit fields.   The program also asks for a channel containing time of day in hours (0-24) and two channels containing environmental temperatures (Te), one for shade and one for sun.   Note: If shade temperature is missing, the program can substitute sun temperature (if available), but only at night.   If sun temperature is missing, the program can substitute shade temperature (if available).   Select these settings in the Data Rejection Rules component of the Thermoregulatory Cost Options menu.

    For each point in the data file, the necessary metabolic rate is computed according to the following rules:

    • if the animal is day-active, whichever Te (sun or shade) is highest is used in calculations.
      Note that if you have only one temperature measurement, or if a day-active species never has access to sunlight (e.g., stays in deep shade), you can select the shade temperature as the sun temperature (in other words, use the shade temperature measurement twice).
    • at Te >= LCT, metabolic rate is set equal to BMR (internally converted to watts)
    • at Te < LCT, metabolic rate is computed as (Tb - Te) * Cth

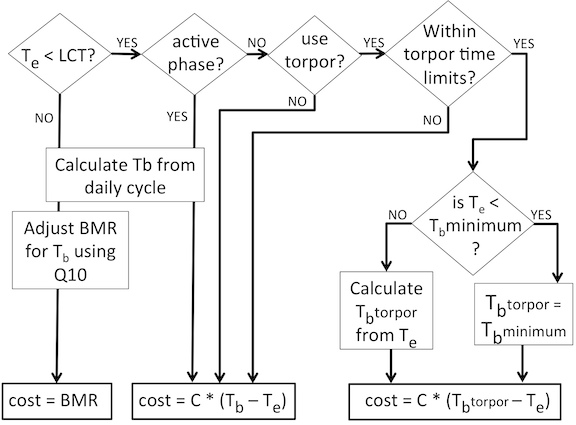
    When Te < LCT in the inactive part of the daily cycle, if the animal can use torpor (selected in the 'options' window), one of two calculations are performed:

    -- if Te is at or above 1 °C less than a minimal (defended) Tb, the metabolic rate is reduced from BMR in proportion to how close Te is to minimum Tb.

    -- if Te is lower than 1°C below the minimum Tb, metabolic rate is computed as   (minimum Tb - Te) * Cth

    -- NOTE:   the torpor algorithms do not include the energy cost of warmup.

    Flowcharts (decision trees) for calculations of environmental temperature and thermoregulatory costs are at the end of this page.

  • Program output includes:

  • mean metabolic rate (watts)
  • factorial increase of mean metabolic rate above BMR
  • highest single metabolic rate (watts)
  • factorial increase of highest metabolic rate above BMR
  • percent of total samples for which metabolic rate = BMR (i.e., Te > LCT)
  • mean metabolic rate for all samples where Te < LCT
  • factorial increase above BMR for mean metabolic rate for all samples where Te < LCT
  • maximum daily average (watts), and expressed as factorial increase above BMR
  • maxima over 6 and 12 hours (watts), and expressed as factorial increase above BMR
  • mean metabolic rate while in torpor (watts), and expressed as factorial change from BMR
  • percent of time spent in torpor

    NOTE:   For nightime data, if a value for shade temperature is missing, the program will attempt to use the user-designated sun temperature value instead.  This substitution does not occur for daytime data.

  • These thermal calculations are performed in one of two ways:

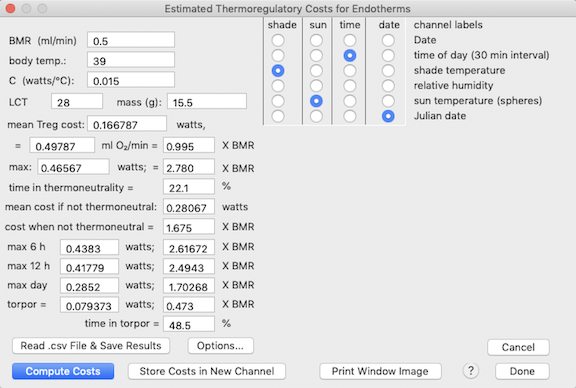
    One individual at a time (click the 'compute costs' button):   The user enters the animal's thermal parameters in edit fields in the main program window, selects the time, sun, and shade temperature channels, and then starts calculations.  Results are shown after all Te data are processed:

           
    Optionally, the computed costs for each entry in the main data file can be saved in a new channel (if the file has < 40 channels).

    Multiple individuals (species) in a spreadsheet (click the 'read .csv file and save results' button):   The user selects the time and two Te channels (sun and shade) and then opens a spreadsheet file (comma separated variables; .csv) containing a series of thermal parameters for different species, sexes, etc.   The maximum number of variables in the .csv spreadsheet is 50.   Each row of the spreadsheet (up to 800) contains data for one individual or species.  You need to select the columns that contain:

    • an indicator (yes, no, y, n, 1, 0) of whether the animal can 'use' sunlight to warm itself.   If true, the calculations use the 'sunshine' value in the main data file of temperature data.

    • body temperature, in degrees C

    • minimum thermal conductance, in watts/degree C (here, degrees C is the gradient between body temperature and environmental temperature).

    • the Lower Critical Temperature (LCT) in degrees C.

    • Basal Metabolic Rate (BMR); the units are either watts or ml O2/min (selected in the 'options' window).

    • an indicator (yes, no, y, n, 1, 0) of whether the animal can use torpor to save energy during the inactive phase (night or day) of its daily cycle.

    • the minimum body temperature (Tb; degrees C) that the animal will tolerate in torpor.   The lowest environmental temperature at which this is achieved without increasing metabolism is assumed to be 1 °C lower than minimum Tb.  At lower Te, the animal will increase metabolic heat production to maintain Tb at the minimum value.   The program uses the thermal conductance value (Cth) to calculate this metabolic rate.

    • an indicator (yes, no, y, n, 1, 0, D, d, N, n) of whether the animal's active phase is during the day (diurnal) or at night (nocturnal).   A 'yes' or '1' value or equivalent means the animal is diurnal.
           

    For each spreadsheet entry, the program runs through the Te channels from the main data file. The combined results can be saved, along with the raw data from the 'source' .csv file, in a user-selected spreadsheet file.

    The program always saves a column containing the mean thermoregulatory cost in watts.

    Other thermoregulatory data columns to be placed in the spreadsheet are selected from the window at right:

    You can adjust the number of days averaged for the 'Highest Daily Mean' value using the window below:

    For both methods, the 'options' button opens a window where you can select a number of alternate ways of handling data and calculations, including:
    • the units for basal metabolic rate (BMR):   watts or ml O2/min.

    • whether to compute results for active time only (and what the hours of daylight are).   Alternately, you can get active time information from channel in a .csv data file.   Currently the hours of daylight are not obtainable from a .csv file and must be entered here.

    • whether to allow for a different euthermic body temperature during the active phase versus the inactive phase (day or night); the value in the data file (or in the main 'Thermoregulatory costs' window) is assumed to be the inactive phase body temperature.   You can also select a maximum body temperature.

    • whether thermal conductance also changes with the daily activity cycle (and if so, how much); the default value is a 1.4X higher conductance during the active phase.

    • a default value of body temperature if that data is missing in a .csv file entry.

    • whether to compute results assuming the animal becomes torpid during the inactive time of day (in a .csv data file this can be indicated by 'yes', 'no', or 'N' or 'n' and 'D' or 'd', or 0 and 1).

    • If torpor is used, the duration of the entry and arousal phases (body temperature is 'ramped' for calculations during these periods), the minimum defended body temperature while in torpor (this can be entered as a variable in a .csv file), and the Q10 value for adjusting metabolic rate during torpor.

    • If torpor is used, the time lags during the inactive phase for the onset and completion of torpor (which often does not occupy the entire inactive phase).

    • If torpor is used, the duration of the entry and arousal phases (body temperature is 'ramped' for calculations during these periods), the minimum defended body temperature while in torpor (this can be entered as a variable in a .csv file), and the Q10 value for adjusting metabolic rate during torpor.

      Note that if you elect to NOT allow torpor use, that restriction will apply globally to all entries in a .csv file.   If you DO allow torpor use, each entry in a .csv file will indicate whether or not torpor is applicable to that entry.

    • Whether a zero value for temperature is treated as missing data (and ignored); the alternate acceptable missing data indicator is a value of -9999.

    • Whether to use constant values for sunrise and sunset times, or compute them from location and Julian date (the day of the year from 1-365).   You will need to enter a location in latitude and longitude (fractional degrees, not degrees and minutes), and the data file with temperature information will need a veriable showing Julian date.

      Times are computed using the ‘Sunrise equation’; this example shows an annual day length cycle for a tropical latitude (~ 14 ° south).

  • The Convection… button opens a window for selecting whether to use wind speed to adjust conductance, and if so, which data channel contains wind speed data..

  • The Set Data Rejection Rules… button opens a window for selecting whether to use wind speed to adjust conductance, and if so, which data channel contains wind speed data..


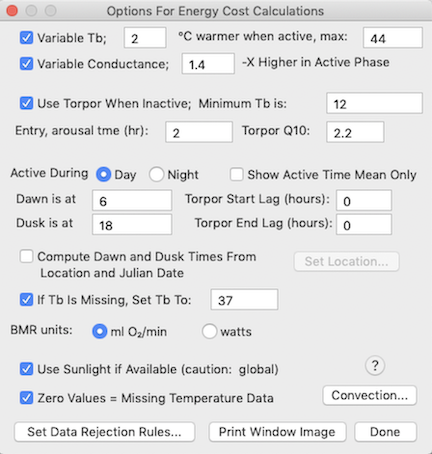
  • The following flowchart shows how environmental temperature (Te) is selected.   NOTE: the 'sphere' temperature is the temperature of a life-sized model of the animal (often a painted metal or plastic sphere) placed in the habitat where it is affected by wind and sunlight -- in the absence of sunlight or some other strong radiant source or sink, sphere temperature ( Tsphere) is the same as air temperature:

    This flowchart shows how Te, time, and physiological parameters are used to compute thermoregulatory energy costs:


    Other links: