| |
Descriptive statistics
|
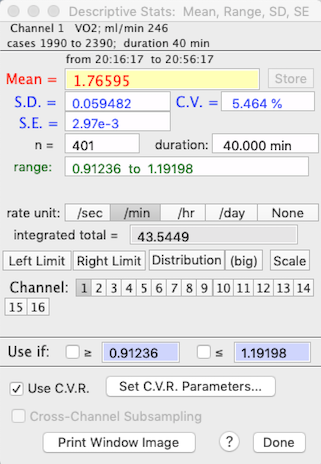
 To get the integrated total for a rate function, such as oxygen consumption, make sure the correct rate unit is selected (i.e., 'per min' if the units are ml/min or 'per hour' if the units are ml/hour). A more sophisticated integration mode is available in the INTEGRATE BLOCK option. If the open file has more than one channel, you can switch channels by clicking on the small numbered channel selection buttons. You can see the channel labels if you 'float' the cursor over these buttons. Use the 'limits' buttons to restrict analysis to a subsection of the block. Click the right or left limit button, then use the cursor to select the limits in the block window. The 'scale' button toggles scaling of the results (see SCALE RESULTS, below). The 'Store' button in this and other analysis mode windows allows you to directly transfer the current mean for use as a scaling factor. When you click 'Store', the scaling factors window appears. Click on any channel's "*" or "÷" button, and the current mean will appear in the first edit field (the multiplication or division factor) for that channel. The 'select,' '≥' and '≤' buttons at the bottom of the window let you get basic statistics for a subset of the block, within the defined numeric limits. Note that there must be at least 3 data points within the subset limits, or the program will issue a warning buzz, turn off the '≥' and '≤' buttons, and default to the previous basic statistics results. If you restrict analysis to a subset
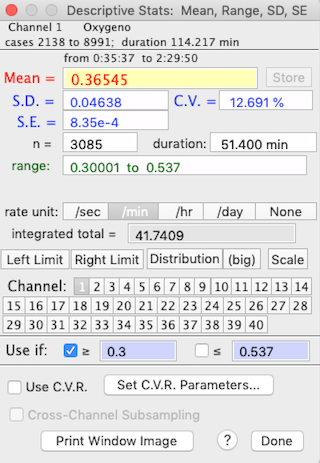
of data, or use cross-channel subsets, a warning window will appear for analyses that '
pay attention' to subset settings. This example shows cross-channel selection
is being used, and within the channel being analyzed, data with values less than 0.5
or greater than 21.12 are ignored. If you restrict analysis to a subset
of data, or use cross-channel subsets, a warning window will appear for analyses that '
pay attention' to subset settings. This example shows cross-channel selection
is being used, and within the channel being analyzed, data with values less than 0.5
or greater than 21.12 are ignored.
The 'distribution' button produces a small histogram (bar graph) of frequency distribution in a small moveable window. You can use the '(big)' button to produce a much larger and more detailed histogram, with control over the number of bins and bin width (see below). If the file has more than one channel, you can click on buttons for different channels and get those means (you can also use the keyboard to select channels). With an option in the PREFERENCES menu, you can have different histogram windows for each channel, or use the same small window for all channels.
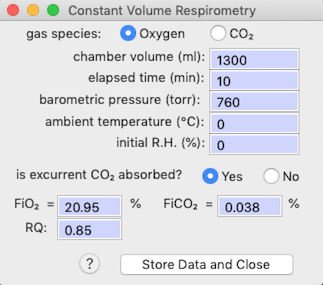
When using the BASIC STATS... (or AVERAGE), MINIMUM VALUE... or MAXIMUM VALUE... functions, a button labeled 'Use C.V.R.' is available. This stands for Cinstant Volume Respirometry, and it opens a window that lets you set up the variables needed to compute O2 or CO2 exchange in a closed system. In constant volume respirometry (or 'closed system' respirometry), the organism is placed in a sealed chamber, and over time its respiration changes the gas concentrations in the chamber. You measure rates of gas exchange by determining gas concentrations (O2 and/or CO2 ) at the start and end of a period of measurement, and then using the cumulative difference in concentrations and the elapsed time to compute the average rate of change. The most straightforward way to handle constant volume calculations with LabHelper and LabAnalyst is as follows:
Note that this option assumes that the data being analyzed are in units of % gas concentration and that baseline has already been corrected. Click the 'Set C.V.R. Parameters...' button and, in the window that opens, specify gas type, chamber volume, elapsed time, chamber temperature, barometric pressure, initial relative humidity in the chamber (if the gas contains water vapor), the initial concentrations of O2 and CO2 (FiO2 and FiCO2), and the respiratory exchange ratio (RQ). You also need to specify whether or not CO2 is absorbed prior to oxygen analysis ('is excurrent CO2 absorbed?' button). When done, click the 'Store Data and Close' button. When C.V.R. data... is activated, the results window (example on the right) shows gas exchange rates in units of ml/min -- but note that only the mean value is computed as gas exchange (the SD, SE, etc. are shown in their original units). To switch off the C.V.R. calculations, click the 'C.V.R. data...' button. Note that this is a “quick and dirty” CVR estimate; a more versatile CVR calculator is in the SPECIAL menu.
|