
| |
Regression
|
|
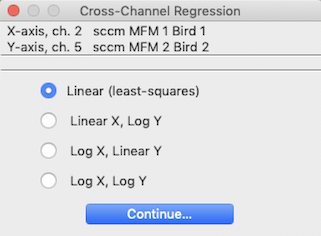
The initial step in the regression procedure is to select the two channels to regress, using the window shown at left. The program won't let you attempt to regress a channel against itself, so you may have to do some fancy button-clicking to get your channels selected. Next, you need to to chose the type of unit conversions. Linear (least-squares), semi-log (log Y = a+b*X or Y = a+b*log X), and log-log (log Y = a + b*log X) regression models are available. However, some of the conversions will not be available if the data range includes zero or negative values (since one can't take the log of a negative number)..
The numerical results are the same as for the SLOPE vs TIME option described above -- except that only a single value of the intercept is shown. You can test the slope against any user-defined value. Enter the slope into the edit field and click the 'Test if p(slope) =' button (very low probability values are shown as "<.00001"). The 'Residuals' button will produce a scatterplot of residuals from the regression. 'Select New Channels' lets you set up a new regression of different variables.
Some additional considerations:
|

 After the 'Continue...' button is clicked, LabAnalyst performs the calculations and produces a scatterplot of the
data points in the block window (x values versus y values), along with the
regression line.
After the 'Continue...' button is clicked, LabAnalyst performs the calculations and produces a scatterplot of the
data points in the block window (x values versus y values), along with the
regression line. You can use the 'Predict Values' button to use
the regression equation to predict X from a given Y, or vice versa:
You can use the 'Predict Values' button to use
the regression equation to predict X from a given Y, or vice versa: