| |
Respirometry menu
|
|
If you are unfamiliar with the fundamentals of respirometry, you might want to read this page before diving into the rest of this section.. Also, John Lighton's book, Measuring Metabolic Rates - A Manual for Scientists is an excellent reference.
Choose one of two computation modes: • Positive-going deflection: Changes in gas concentration are positive with respect to baseline (the default). • Negative-going deflection: Changes in gas concentration are negative with respect to baseline. This can be used if -- as in oxygen consumption -- gas exchange is measured as a depletion of gas concentration. Many users find positive-going deflections more intuitive, but the negative-going option is available if desired. Results are stored either in the source channel or optionally (if there are less than 40 channels) in a new channel. Gas calculations begin with flow rate source selection. Flowrate is entered from the file or by the user, or is obtained from a channel (i.e., recorded from a flow meter during acquisition).
For VO2 and VCO2, you need to specify: • whether incurrent CO2 is absorbed – note that 'incurrent' refers to gas entering the metabolism chamber, NOT to gas entering the analyzers. If you are using ‘standard’ air (where the CO2 concentration is about .04%), this option has little effect. • concentrations of O2 and CO2 in ambient (baseline) gas (FiO2 and FiCO2; default 20.95% and 0.04%, respectively – note that the program expects these to be entered as percentages, not fractions ).
For relative humidity sensors, you will also need to indicate operating temperature of the sensor (this is done later; see below). Channel selection: In the next window (below,left) you select the channel containing gas concentration data, and if you are obtaining flow from a channel, the flow rate channel: Flow configurations: Next you select a flow configuration ('Mode' 1, 2, etc.). This specifies the conversion equation to be used, based on where flow rate is measured (upstream or downstream of the animal chamber and gas sensor) and how (and if) the the gas stream is dehumidified and scrubbed of CO2.
Pick the configuration and mode closest to your own respirometry system. It's quite important to give LabAnalyst the right information about your flow arrangement. In some -- but not all -- cases, with 'normal' incurrent concentrations of CO2 and O2 (about 0.04% and 20.9%), different modes yield fairly similar results. However, in some cases, serious errors (20% or more) can result if the wrong equations are used (this is most problematic for VO2). Selecting the appropriate configuration is most critical if the sample gas from the animal chamber has large deflections from ambient concentrations of CO2 and O2. An important and easily avoidable error will result if the gas stream at the flow meter contains a significant (but unknown) fraction of water vapor. Therefore it's good practice to use DRY gas whenever possible -- and if you can't, be sure to compensate as described in the next section.
As can be seen in this diagram, the importance of water vapor compensation is greatest at high ambient temperatures and high humidities. For example, at a temperature of 30 °C, saturated air (100% R.H.) is about 4 percent water vapor by volume. That proportion increases to about 7 percent at 40 °C. Keep in mind that these values are for a total barometric pressure of 1 atmosphere. Since saturation vapor pressure at a given temperature is constant regardless of the total pressure in the system, the fractional water vapor content increases as total pressure decreases. For example, if you are working at an altitude of 2000 meters (where atmospheric pressure is roughly 590 torr), saturated air at 30 °C contains about 5.4% water vapor by volume. You can reduce or avoid these errors by using estimates of humidity, or preferably measurements of humidity or dew point, to calculate the volumetric fraction of incurrent gas comprised of water. This figure should give you some idea of the need to compensate, given the temperature and pressure conditions you work with. Note that the temperature and pressures of importance are those at the position of the flowmeter, and not elsewhere in your system. Clearly, if you are working at fairly low humidities and the temperature of your flowmeter is about 20 °C or lower, the expected error is on the order of 1% or less, and probably can be safely ignored. Even in fairly warm conditions (around 30 °C), you can reduce the expected error to about 2% if you can guess relative humidity within 50%. Note that if relative humidity is used, it's usually necessary to adjust to ambient barometric pressure and ambient temperature (even if flow rate has already been set to STP). This is because the partial pressure of water vapor is constant at a given combination of relative humidity and temperature, regardless of the partial pressure of the rest of the gas mixture. You also have the option of not compensating, if you wish.  
You are next asked for a channel containing humidity (or water vapor) data; alternately you can use a constant RH (the default is 20%). This is shown below, at left. Next you are next asked whether the humidity data are in units of relative humidity or dew point temperature (below, at right):
|
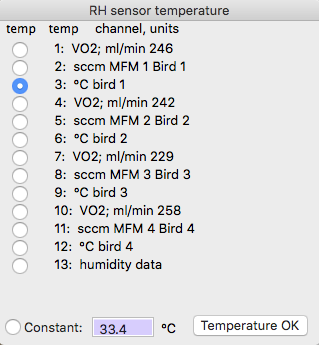 If the data are in
units of relative humidity, you are asked to select a channel containing
humidity temperature data (as shown at right), or a constant temperature
for the RH sensor. Note that this is usually NOT the same as the temperature of the flowmeter (both are required for accurate calculations). If the data are in
units of relative humidity, you are asked to select a channel containing
humidity temperature data (as shown at right), or a constant temperature
for the RH sensor. Note that this is usually NOT the same as the temperature of the flowmeter (both are required for accurate calculations).
The software will compensate for temperature differences between the humidity sensor and the flowmeter.
Compensating for RQ: One of the many troublesome complications in respirometry is that organisms seldom exchange just one gas at a time: instead, they are simultaneously consuming oxygen and producing CO2 (we'll leave water out of this discussion because -- usually -- it can easily be scrubbed from air streams prior to gas analysis). Since the ratio of CO2 produced / oxygen consumed (the Respiratory Quotient, or RQ) is seldom exactly equal to 1.0, respiration causes a net change in the total gas volume. As a result, gas concentrations are affected. For example, consider a calculation of oxygen consumption: If more oxygen is consumed than CO2 is produced, the total gas volume is slightly reduced, which results in an increase in the concentration of O2. This seemingly trivial imbalance will influence exchange calculations and needs to be accounted for (startlingly large errors can result if you don't do this correctly). The necessary equations can be derived from simple algebra, but are tedious in practice (click here for a simple example). Fortunately, equations for most respirometry systems are built into LabAnalyst (see below for details).
Similarly, if you are calculating CO2 production, you will always need to compensate for oxygen consumption (since animals rarely produce CO2 unless they are also consuming O2) and you are asked if you want to use a constant RQ value, or oxygen concentration data (in % deflection from ambient O2 concentration), or a previously computed channel containing VO2 in units of ml/min. In most cases, use of a constant RQ will produce quite good accuracy. Units: As a last step, you need to select the units for gas exchange. In the final window of the sequence, you are presented with 4 or 5 edit fields containing mass, B.P., Ta, etc. Adjust these as necessary. You can select from a variety of conversion units in the pop-up menu (shown at right with ml/min selected).
You can click buttons to select appropriate values for carbohydrate, lipid, or protein substrates. It is possible to directly enter your own value into the edit field, however. You can show the conversion equation by clicking the 'show equation' button: Conversion equations and options Equations used for computing exchange rates are derived in part from Depocas and Hart (1957; J. Appl. Physiol. 10:388-392), Hill (1972, J. Appl. Physiol. 33:261-263) and Withers (1977, J. Appl. Physiol. 42:120-123); others I derived myself. If you want to see a (relatively) simple example of deriving an equation for VO2, look at this page. The following symbols are used: FR = flow rate, V = exchange rate for the gas in question (oxygen, CO2, or water vapor), STP = factor for converting to standard conditions of temperature and pressure, Fi = input fractional concentration, Fe = excurrent fractional concentration, RQ = respiratory quotient.
For VO2, the calculations depend on the position of the flowmeter and whether (and where) water vapor and CO2 are absorbed. Flow rate (FR) through the metabolism chamber is best measured upstream from the chamber in most cases. If you need to humidify the air stream, the best arrangement is to use an upstream flow meter, with the air dried before it enters the flow meter and then re-humidified between the flow meter and the chamber. For accurate calculations it is usually necessary to remove water vapor and helpful to scrub CO2 from the air stream downstream from the animal chamber, before O2 content is measured.
For some flow configurations you need to know RQ for accurate calculation of VO2 , or you must have a previously computed channel containing VCO2 in ml/min, or have data on %CO2 in excurrent air (expressed as the difference from incurrent CO2 concentration). If the animal is metabolizing carbohydrate, RQ is 1.0; if it metabolizes fat the RQ is about 0.7; if it metabolizes protein the RQ is about 0.8. Mixed diets yield intermediate RQ. If you don't know RQ or diet, the potential error is minimized if you use the default RQ of 0.85 (see Gessaman and Nagy 1988 and especially for estimates of energy equivalence: Koteja 1996, Functional Ecology 10, 675-677). Also, you should be aware that there are situations where the CO2/O2 ratio can exceed 1.0 (for example, if the animal is depositing fat).
For VCO2, you need to know RQ, or you must have data on oxygen content or consumption. If you don't know RQ or diet, use the default RQ of 0.85, which usually produces results with an error of <5%. Alternately, you can use a previously-computed channel containing VO2 in ml/min, or have data on %O2 in excurrent air (in difference from incurrent O2 concentration). The equations (which assume gas is dry when FeCO2 is measured) are as follows:
For Evaporative Water Loss (VH2O), the program assumes that due to O2 consumption and CO2 production, there are gas volume changes between the part of the system where flow rate is measured (whether upstream or downstream of the chamber) and the point where water content is measured. The 'full' equation is:
where EWL is ml H2O vapor/min; the program applies an appropriate correction for whatever output units are selected. If you only measured O2 content (and not CO2), then FeCO2 is estimated from FeO2 and RQ: In the above equations, VO2 (and VCO2 in the first case) are read from a data channel. You can also use a constant VO2 if your data file contains only humidity data. These equations (from Withers 2001, Aust. J. Zool. 49) are fairly complex, and figuring out FiH2O and FeH2O from typical humidity data is also complicated, because of the non-linear relationship between temperature and the water content of a gas. Water vapor content is usually measured as either percent relative humidity or dew point temperature (in °C); some instruments can output vapor pressure as Pascals (or kiloPascals), or vapor density as g H2O vapor / m3 (same as mg H2O / L or µg H2O / mL). Select the appropriate units for your humidity sensor's output. For any units, values must be converted into water vapor densities and then into fractional concentrations. The equations for computing water vapor density are arithmetically rather nasty (and therefore the speed of conversion isn't as fast for some EWL calculations as for other kinds of gas exchange). If you use % RH, the algorithms need to know the temperature of the humidity sensor. You can either enter this directly or the value can be obtained from a data channel. In the latter case, and for all analyses of dew point data, vapor density calculations must be repeated for each sample point. That slows the rate of conversion considerably, so a progress bar is shown if the number of samples is high. The algorithms used to compute vapor density are derived from Properties of Air, by Tracy, Welch, and Porter (1980; University of Wisconsin; you can find a pdf on the Web via Google Scholar). In turn, these are based on the Smithsonian Meteorological Tables. For those interested, the formulae used are as follows: • Vapor pressure (pw) at temperatures over liquid water (Smithsonian Tables, 1984, after Goff and Gratch, 1946):
Log10 pw = -7.90298 (373.16 T-1) • Vapor pressure (pi) at temperatures below 0 °C (over ice; Smithsonian Tables, 1984):
Log10 pi = -9.09718 (273.16/T - 1) The Goff-Gratch equation (for air over liquid water) covers a temperature range of -50 °C to about 100 °C, but is mostly theoretical for very low temperatures. Accuracy is probably ±0.5% or better at temperatures between -20 and 70 °C.
Miscellaneous notes for gas exchange: The 'instantaneous' correction helps compensate for the volumetric washout characteristics of respirometry systems, using the 'Z' correction approach modified for exponential washout kinetics (Bartholomew, Vleck, and Vleck 1981, Journal of Experimental Biology 90, 17-32). It works best in systems with large flow rates relative to effective volume. In general, it is prudent to avoid this somewhat rude manipulation of data if the system volume is large and the flow rate is low, unless the chamber is very well stirred (as in a recirculating wind tunnel or a chamber with mixing fans). In particular, be aware of the following:
Basically, the instantaneous conversion algorithm works from estimations of how rapidly a gas concentration that has been transiently deflected from a constant value will return to a state of zero deflection if no other changes occur. Another way of putting it is as follows: if an animal instantly changes its metabolism to a new steady-state value, how long does it take for the excurrent gas concentrations to achieve their new steady state values? An instantaneous change in metabolism will be detected at the gas analyzer as a gradual approach to new steady-states, as shown schematically here: What the 'instantaneous' conversion does is back-calculate from the measured concentration changes to approximate the real event: For VO2 calculations the algorithm assumes incurrent oxygen concentration is 20.95% and offset so as to read zero at 20.95% oxygen. For carbon dioxide and water vapor it assumes that incurrent concentrations are zero % (not offset). Calculations will yield inaccurate results if these assumptions are violated. The so-called effective volume (below) is necessary for these calculations. It can be derived from a washout curve for the system being used. The response correction option in the TRANSFORMATIONS routines (EDIT menu) can also adjust for mixing problems and washout characteristics. It is based on an unmodified Z-transform, and in some cases may be easier to use than the instantaneous correction.
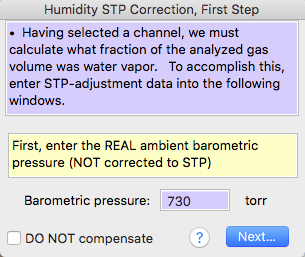
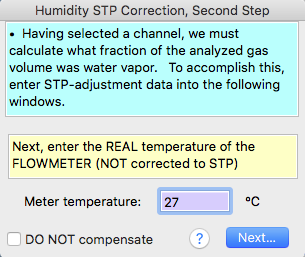
In order to accurately compute gas exchange rates from undried gas, it is necessary to remove the dilution effect of water vapor in the gas stream (which slightly reduces the concentration of O2 or CO2 in the gas analyzer). This causes an underestimate (VCO2) or overestimate (VO2) of 'true' gas exchange rates. The resulting error is small if the temperature and relative humidity of the measured gas are low, but increase rapidly as temperature and humidity climb (see the figure in the section on water vapor correction showing the volumetric contribution of water vapor at different temperatures and humidities). Low barometric pressure increases the error still further. You use several methods for compensating for measurements on wet gas, but for all of them you must provide information of the temperature and water content of the measured gas stream. You can use recorded channels of relative humidity or dew point, or provide a constant value. Similarly, you can use recorded or constant values for temperature. These are selected through a series of windows. Note that some combinations require extensive vapor pressure calculations for each data point, which slows the computation speed; in these cases a progress bar is shown.
Entering the required data involves several successive windows, the first of which is shown at right.
However, for VCO2, or %CO2, or unadjusted O2 content, water vapor tends to decrease the calculated VCO2 (or VO2) because it reduces concentrations. This seems confusing, but remember than animals consume oxygen (i.e., lowering O2 content of air going to the sensor) but produce CO2 (i.e., raising CO2 content of air going to the sensor). Finally, you can select if you want to store the result in a new channel (if the number of channels is less than the maximum channel count).
Note that it's usually necessary to adjust to ambient barometric pressure and ambient temperature (even if flow rate has already been set to STP). This is because the partial pressure of water vapor is constant at a given combination of relative humidity and temperature, regardless of the partial pressure of the rest of the gas mixture. You also have the option of not compensating, if you wish. As mentioned previously, if the temperature is low and pressure is reasonably close to nominal sea-level pressure (760 torr), accuracy may not be greatly compromised if you elect not to compensate.
You are next asked for a channel containing humidity (or water vapor) data; alternately you can use a constant RH (the default is 20%). This is shown below, at left. Next you are next asked whether the humidity data are in units of relative humidity or dew point temperature or (if using vapor pressure) if the units are kilopascals or micrograms/mL (below, at right):
|
|
If the data are in units of relative humidity, you are asked to select a channel containing humidity temperature data (as shown at right), or a constant temperature for the RH sensor: Once all these data are entered, the software will compensate for temperature differences between the humidity sensor and the flowmeter. Back to top
|
|
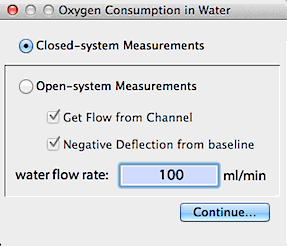
Most of these parameters can be edited with the EDIT FILE DATA option, including flow rate, barometric pressure, temperature, and container volume (= effective volume). Alternately, you can enter your own O2 content data (dissolved oxygen per unit volume) and click the 'net O2' button, or you can directly enter net O2 content (total dissolved oxygen). If there are less than 40 channels in the file, you can store results in a new channel. For closed-system measurements, there are three conversion options. For any of these, you can generate absolute units or mass-specific units (per mg, per g, or per kg). Note that all conversions are based on the value shown in the 'net O2 content' edit field. If you know that oxygen content differs from the computed value in this edit field, you can enter your own value prior to doing the conversion.
Here is an example showing conversion into consumption rate (ml O2 / [g . min]):
The Open-system (flow-through) routine will only compute oxygen consumption rate, in your choice of units. You can use either of two algorithms, selected with buttons in the initial window:
Deflections in O2 concentration in the excurrent stream may be either positive or negative (if the latter, click the 'negative deflection' button in the initial window). 
This window appears automatically during gas exchange calculations if you select output units of energy instead of gas volume.
To generate a washout curve, set up the respirometry system as it is normally used (but without an animal) at the flow rate used for measurements. Make a recording of gas concentration, starting at equilibrium levels. After establishing a baseline, deflect concentration by rapidly exhaling into the incurrent flow upstream from the chamber (or quickly inject a bolus of some gas with different concentration than reference gas). Continue recording as gas concentration rapidly peaks, slowly declines, and eventually returns to equilibrium concentration. Save the data. In LabAnalyst, correct the baseline to zero, even for oxygen files (it will probably help to smooth the data also). Mark a block in the washout curve as it returns to equilibrium. Usually it is best to select from the middle of the washout curve. Then select the effective volume option. LabAnalyst will request the flow rate and compute effective volume. Flow rate measurement accuracy In open-system respirometry, the most frequent source of error is probably inaccuracies in measurement of gas flow rate. Aside from the required correction to standard temperature and pressure (STP; 0 °C, 760 torr), there are several common problems that can compromise accuracy:
Other common sources of error
|
 These functions convert gas concentrations -- O2, CO2, H2O -- into rates of gas exchange: VO2, VCO2, evaporative water loss (EWL). Gas concentrations should be in units of % or for EWL, % RH, vapor pressure, or dew point temperature. The program expects gas concentration to be expressed as difference from reference levels, with reference (baseline) set to zero (in the
  For EWL calculations (VH2O), and for VO2 and
VCO2 if you did not use dry incurrent gas,
you will also need to indicate the type of sensor used to measure the water vapor content. Most lab-grade humidity sensors output relative humidity (the current humidity relative to saturation water content), dew point (the temperature to which air must be cooled to become saturated with water vapor), or water vapor pressure, either in units of pressure (usually pascals or kilopascal) or mass/volume (usually micrograms/mL, mg/L or grams/m3; all of these are equivalent).
For EWL calculations (VH2O), and for VO2 and
VCO2 if you did not use dry incurrent gas,
you will also need to indicate the type of sensor used to measure the water vapor content. Most lab-grade humidity sensors output relative humidity (the current humidity relative to saturation water content), dew point (the temperature to which air must be cooled to become saturated with water vapor), or water vapor pressure, either in units of pressure (usually pascals or kilopascal) or mass/volume (usually micrograms/mL, mg/L or grams/m3; all of these are equivalent).

 The 'masks' button (VO2 and VCO2 only) opens a similar window with a selection
of mask configurations (example for VO2 shown at right). A mask system is defined as one in
which unscrubbed ambient gas - usually air - is pulled past the animal to
capture exhaled gas (i.e., gas is sucked past the animal under negative
pressure). In mask systems all pumps, flow meters, gas analyzers,
etc. are downstream.
The 'masks' button (VO2 and VCO2 only) opens a similar window with a selection
of mask configurations (example for VO2 shown at right). A mask system is defined as one in
which unscrubbed ambient gas - usually air - is pulled past the animal to
capture exhaled gas (i.e., gas is sucked past the animal under negative
pressure). In mask systems all pumps, flow meters, gas analyzers,
etc. are downstream.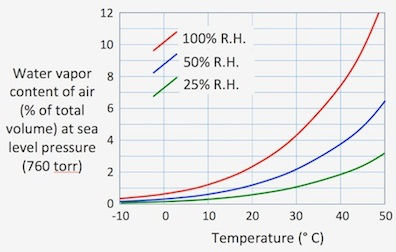 Compensating
for water vapor: In some flow arrangements, flow rate is
measured on a 'wet' gas that is -- usually -- subsequently dried prior to measuring O2 or CO2 concentration
(this includes modes 1 and 2 for VO2 and
mode 1 for VCO2 [if incurrent gas isn't
dry], and most mask systems). In such cases it may be necessary
to compensate for the water vapor content. It is also necessary to
compensate for water content if O2 or CO2 concentration is measured with a 'wet' gas
containing water vapor (see the
Compensating
for water vapor: In some flow arrangements, flow rate is
measured on a 'wet' gas that is -- usually -- subsequently dried prior to measuring O2 or CO2 concentration
(this includes modes 1 and 2 for VO2 and
mode 1 for VCO2 [if incurrent gas isn't
dry], and most mask systems). In such cases it may be necessary
to compensate for the water vapor content. It is also necessary to
compensate for water content if O2 or CO2 concentration is measured with a 'wet' gas
containing water vapor (see the 

 The next window is for flow rate compensation due to the animals' gas exchange (these effects are usually quite small, however). As for oxygen consumption and CO2 production, calculation of evaporative water loss necessitates compensation for the change in flow rate induced by the animal's metabolism -- oxygen uptake and CO2 emission -- as well as by evaporative water loss itself. This can be done in three ways:
 If you are calculating
oxygen consumption and you use a flow configuration that requires compensation
for CO2 production, you are asked if you
want to use a constant RQ value, or a previously computed channel
containing VCO2 (note that VCO2 must be in units of ml/min, or you may get
extremely inaccurate results),
or CO2 concentration data (in %
deflection from ambient CO2 concentration).
If you elect to use VCO2 or %CO2
, you will be asked to select the channel containing CO2 data. For maximal precision, be sure
to use the
If you are calculating
oxygen consumption and you use a flow configuration that requires compensation
for CO2 production, you are asked if you
want to use a constant RQ value, or a previously computed channel
containing VCO2 (note that VCO2 must be in units of ml/min, or you may get
extremely inaccurate results),
or CO2 concentration data (in %
deflection from ambient CO2 concentration).
If you elect to use VCO2 or %CO2
, you will be asked to select the channel containing CO2 data. For maximal precision, be sure
to use the 


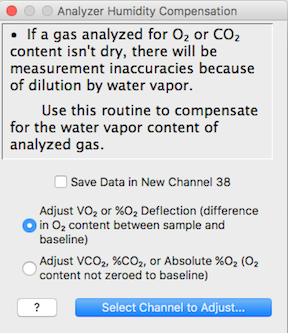 You need to choose between VO2 or %O2 deflection (the difference between breathed and inbreathed air) versus VCO2, %CO2, or absolute %O2 content (i.e., the 'raw' concentration of O2 prior to zeroing to baseline). This selection is necessary because water vapor in the sensor dilutes the concentrations of other gases. If you calculated VO2, or zeroed O2 content relative to reference, that dilution will artifactual increase the calculated VO2 (because it increases the difference between the O2 content of dry, unbreathed air and humid breathed air).
 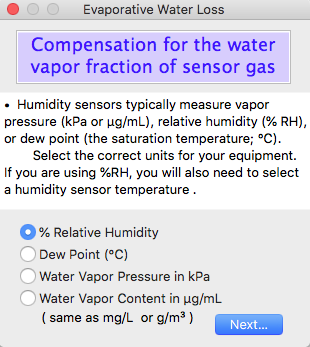 Next, you need to specify the type of humidity measurement, which can be relative humidity, dew point temperature, vapor pressure (kiloPascals), or vapor pressure (micrograms/mL). At this stage, indicate whether you are using vapor pressure or RH or dew point.