|
This
routine will calculate oxygen depletion curves or rates of O2
consumption of aquatic organisms, based on changes O2
concentration. The latter can be expressed in a variety of units: oxygen
partial pressure, i.e., pO2 (torr), percent
saturation of oxygen (zero to 100%), parts per million O2
(by mass), or mg O2/Liter (note that the
latter two units are identical).
- For closed-system measurements, LabAnalyst estimates the amount
of dissolved oxygen in the container at the start of measurements from
container volume, temperature, solute concentration, initial oxygen saturation,
and the partial pressure of O2 in the gas
phase (calculated from barometric pressure and the percentage of O2 in the gas mixture, and accounting for the
water vapor content of air at 100% RH).
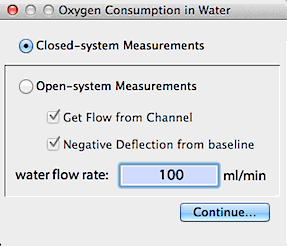
- For open-system measurements, LabAnalyst estimates the amount
of dissolved oxygen in the water flux through the system from temperature,
solute concentration, initial oxygen saturation, and the partial pressure
of O2 in the gas phase (calculated from
barometric pressure and the percentage of O2
in the gas mixture, and accounting for the water vapor content of air at
100% RH). Flow rates are obtained either from a channel or from keyboard
entry (you can also specify whether deflections in oxygen content are positive
or negative).
Most of these parameters can be edited with the EDIT
FILE DATA option, including flow rate, barometric pressure, temperature,
and container volume (= effective volume). Alternately, you can enter
your own O2 content data (dissolved oxygen
per unit volume) and click the 'net O2' button, or you can directly
enter net O2 content (total dissolved oxygen).
If there are less than 40 channels in the file, you can store results
in a new channel.
For closed-system measurements, there are three conversion options.
For any of these, you can generate absolute units or mass-specific units
(per mg, per g, or per kg). Note that all conversions are based
on the value shown in the 'net O2 content'
edit field. If you know that oxygen content differs from the
computed value in this edit field, you can enter your own value prior to
doing the conversion.
- cumulative oxygen content. This simply converts the input data
(% saturation, pO2, ppm, mg/L) into the
residual oxygen content of the container. You can select several
different output units, such as mL, microliters, mmoles, or micromoles.
The slope of this line over time (multiplied by -1) is the average rate
of oxygen consumption (VO2).
- total oxygen used. This option computes the cumulative
amount of oxygen used during the measurement, again with a choice of output
units. The slope of this line over time is the average rate of oxygen
consumption. As for the previous option, several choices of units
are available.
- oxygen consumption rate. This computes the rate of oxygen consumption
(VO2; in a choice of units) by taking the
point-to-point derivative of the relationship between oxygen use and time.
Note: unless the input data have been highly smoothed,
results may be noisy when averaged over short time intervals. However,
long-term VO2 averages should be quite
accurate, provided the O2 consumption
of the organism was stable over time.
Here is an example showing conversion into consumption rate (ml
O2 / [g . min]):

The Open-system (flow-through) routine will only compute oxygen
consumption rate, in your choice of units. You can use either
of two algorithms, selected with buttons in the initial window:
- In absolute value mode, input data are assumed to be absolute
values, and VO2 is calculated by subtracting
them from baseline O2 concentration (i.e.,
the amount of O2 in the incurrent water
stream). Baseline O2 concentration
is computed from pressure, temperature, etc. as described above.
For example, if baseline O2 concentration
is 100% saturated, an oxygen saturation datum of 1% is assumed to mean
that 99% of the oxygen in the water stream has been consumed, and
VO2 is computed accordingly.
- In change from ambient mode, baseline O2
concentration must be offset to zero (this should be done with the
BASELINE option prior
to oxygen calculations). In other words, an oxygen saturation datum
of 1% is assumed to be a 1% change from baseline percent, not an
absolute value of 1%.
Deflections in O2 concentration in the
excurrent stream may be either positive or negative (if the latter, click
the 'negative deflection' button in the initial window).
|
