SPECIAL menu

The 'Special' menu contains several utility functions, calculators, and converters.

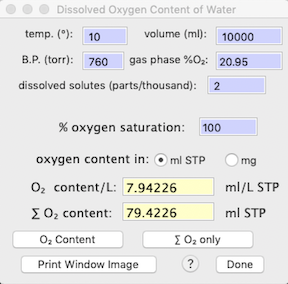
Most 'Special' menu calculators have a 'Print Window Image' button near the bottom of the window.   This sends a copy of the window contents to either a printer or to a graphics file (pdf, png, etc.).


  •   SIMPLE MATH calculator This is 
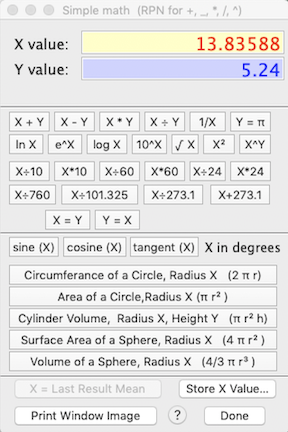
a basic calculator with some additional keys that are specific to data acquisition.  Along with standard math operations, it contains keys for time unit or rate conversions (multiplying and dividing by factors of 60 and 24), pressure (760, 101.325, etc.), Kelvin temperature, and a number of surface and volume conversions frequently used by physiologists and other scientists.  

    The calculator has an RPN function with addition, subtraction, multiplication, and division (which should be familiar to users of HP desk calculators).   Note that you should use the underline key (_) instead of the minus key (-) for subtraction (this is because the minus key is assumed to indicate a negative number, not subtraction).

    Also note that when computing sines, cosines, or tangents, the calculator expects angles in degrees (not radians).

  •   SIMPLE REGRESSION calculator This window lets you perform simple linear or 2-order polynomial regressions.   It is not intended to replace the much more sophisticated regression algorithms found in dedicated statistics packages:   it doesn't provide a lot of the standard regression statistics, and there is an upper limit of 20 X-Y variable pairs (you need to enter at least three).   Once the data are entered, clicking the 'Calculate Regression' button computes and displays the regression coefficients and shows a plot of the data and regression line:

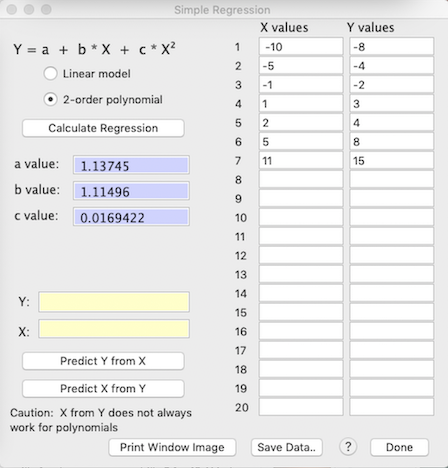
    • Once a regression has been computed, you can use the 'Predict Y from X' and 'Predict X from Y' buttons to interpolate values (but note that predicting X from Y does not always work in polynomial regressions).

    • The X and Y values will be remembered if you close this window and subsequently re-open it (but are lost when you quit LabHelper).


    • EXPRESSION EVALUATOR...     This routine lets you write a mathematical expression, enter numeric values for the expression variables, and have the computer solve it for X and (optionally) Y values.  The program parses the expression into components and performs the operations.
    The expression evaluator understands the following symbols (upper or lower case entries are OK):

    • Simple operators: + - * / ^ ( )
    • Complex operators: EXP, LOG or LN, LOG10, SIN, COS, TAN, ATN or ATAN, ABS, INT, SQR (square), SQRT (square root)
    • Two special variables (i.e., channels) named "X" and "Y", chosen with push-buttons (see image below)
    • PI (or the equivalent Greek letter)
    • Numbers (such as 5, -3.1889, and 1e-10)
    • You can add a comment at the end of your expression, delineated with the " ` " character.

    Some general considerations:

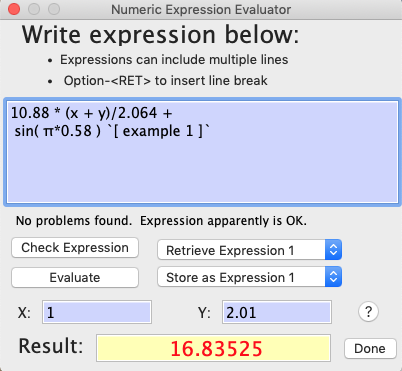
    • You can store and retrieve up to 4 expressions using the 'Retrieve Expression x' and 'Store as Expression x' popup menus.   This will save the trouble (and error potential) of re-entering frequently-used expressions at each use.

    • The 'Check expression' button does a preliminary parsing of the expression and indicates if there are any syntax errors (in the above example, this button has been clicked).

    • The 'Evaluate' button processes the expression using the X and Y values you entered.  If any errors are found (see below), a warming message is shown.

    NOTE: This routine will only 'catch' errors in the basic numeric expression.  It may not detect invalid or meaningless math operations that may be attempted when data are processed, such as division by zero, or taking the log or a non-integer exponent of a negative number.  If such situations occur, results may be unpredictable.

  • The underlying code for the expression evaluator was developed by the late, great Robert Purves (deceased a few years ago, and greatly missed by the FB community).  I 'borrowed' it -- with his permission -- and made some modifications for LabHelper.  But Robert P. deserves all the creative credit.


  •    The STP ADJUSTMENT calculator lets you correct for the effects of temperature and pressure on measured flow rates.  'STP' means Standard Temperature and Pressure; by convention this is 760 torr (sea level atmospheric pressure) and 0 degrees C.   The calculator functions for both continuous flow measurement devices and volume measurements (i.e., volume by time), and can account for differential internal pressure in the measurement device.

    Top of page

  •    ALTITUDE & PRESSURE...     Computes the relationship between pressure and altitude, based on standard meteorological data (Smithsonian Meteorological Tables).  
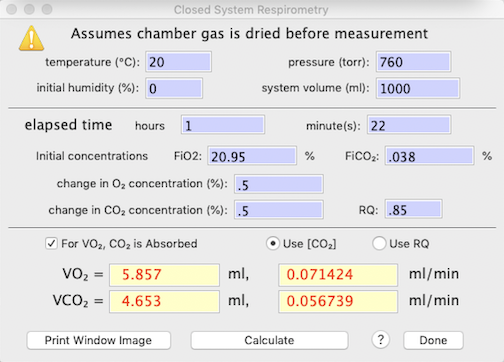
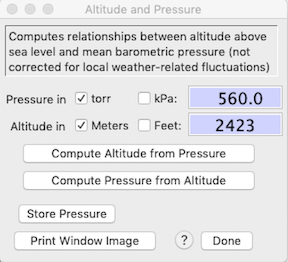
This does not adjust for any effects of weather on local pressure.

    Note that due to rounding errors, the calculations are not 100% reversible (e.g. computing the pressure at a given altitude and then using that computed pressure to calculate altitude will not yield the identical initial altitude -- but it will be very close).

  •       ALTITUDE SIMULATION...     This calculator will compute the appropriate gas concentration to simulate one altitude at the barometric pressure of another altitude.  For example, you might want to use a custom mixture of oxygen and nitrogen in a lab at sea level to simulate the partial pressure of oxygen at high altitude (say, 4000 meters).  Oxygen is the most likely gas of interest but the calculator will also work with other gases.


    Top of page

  •   pO2 ESTIMATION... You can use this calculator to determine the partial pressure of oxygen (pO2) -- or any other gas species in a mixture -- from ambient temperature, ambient pressure (in the gas phase), fractional concentration of the gas species of interest in a dry gas mix, and the percent saturation of water vapor (i.e., relative humidity) in the gas phase. Oxygen (or other gases) are diluted by water vapor, and the degree of that dilution depends on RH and temperature.

    In the example at right, pressure is sea level standard atmospheric pressure(760 torr), temperature is the typical mammalian body temperature (37 °C), etc. Note that at this temperature the saturation vapor pressure of water is about 47.6 torr (this is not affected by the total pressure in the system).

    Other considerations for this calculator:

    • The calculated pO2 value is applicable for the gas phase, and also for dissolved oxygen, as long as the solution is fully saturated with O2.

    • The default pressure (torr or kilopascals, kPa) is obtained from the current data file; the default temperature is 37 °C, and the default fractional gas concentration is .2095 (20.95%, the normal oxygen content of dry atmospheric air). 

  •   DISSOLVED OXYGEN... This calculator determines the amount of oxygen dissolved in a given volume water, as a function of partial pressure, temperature, and salinity (dissolved solutes).

    In the example at right, pressure is sea level standard atmospheric pressure (760 torr), temperature 10 °C, the water is fully saturated with oxygen, and there are 2 parts/thousand of dissolved solutes (reasonable for fairly fresh water). The calculator provides the dissolved oxygen per unit volume, and for the total volume.

    Top of page

  • METABOLIC ALLOMETRY...    'm'   Use this somewhat specialized utility to make estimates of an animal's resting metabolism, based on its size and taxonomic affiliation.  The metabolism calculator has many potential uses; for example, you might want to use it as a 'reality check' if you think your own metabolic data are unexpectedly high or low.
                The initial popup menu contains some very generalized equations, and also allows you to switch to submenus for specific taxa (arthropods, fish, birds, mammals, etc.).  For most taxa, several different equations are available (from different literature sources, which are described in the 'help' field to the right).  You can also pick the desired output units.  The energy equivalence of metabolism (joules per ml of oxygen consumed) is set at 20.1 joules/ml (this varies -- but not by very much -- with different metabolic fuels).  The mass coefficient in the allometric equation ('a' value) is adjusted to reflect whatever output unit is in use.  Results can be stored for later use.

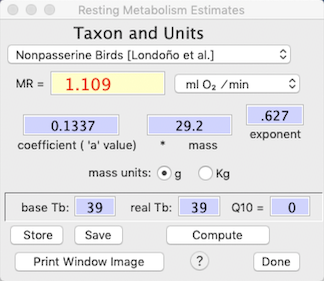
    Metabolism for all taxa are calculated from power functions:

                metabolism = a Mb

    (where a is the mass coefficient, M is mass, and b is the mass exponent)

    This example shows an estimate of the resting metabolic rate (RMR) of a 37.3 g bird, in units of ml O2/min.  The equation was derived from a paper published by Andrew Mckechnie and Blair Wolf (Click here for a list of the references from which allometric equations were obtained.).
                Note that the mass coefficient ('a' value) and mass exponent are shown and can be edited, and that mass can be in either grams or kilograms.  Also, it is possible to make corrections for the effect of body temperature by making the appropriate adjustments to the value of Tb and Q10 (in this example, the 'base' Tb, from which the equation was derived, is equal to the current Tb so no temperature correction occurs).  After changing values in the edit fields, click the 'Compute' button to display the new results.

  •    MINIMUM FLOWRATE...      This is similar to the Metabolic allometry calculator, but it also makes an estimate of the flow rate necessary to maintain an acceptable oxygen concentration within a metabolism chamber.  This example shows a calculation for a small shark in brackish water (since the osmolarity of water affects its oxygen capacity).   Note that the osmolarity popup appears only for fish metabolism.   Also keep in mind that the calculation is based on a user-entered maximum change in gas concentration or percent saturation, not on the absolute concentration or partial pressure of oxygen.


    You can also adjust the activity intensity for the animal, ranging from inactive (minimal metabolism; MMR) to average daily metabolism (3 X MMR)to very vigorous activity -- up to 100X MMR, which is reasonable for some large flying insects. 

  •   CHAMBER WASHOUT…     All metabolic chambers act as 'mixing boxes' for respiratory gases and the incurrent flow of respiratory fluid (gas or water).  Unless flow rates are extremely high relative to chamber volume (in which case it may be difficult to attain a sufficent change in respiratory gas concentrations to measure accurately), the excurrent gas concentrations are integrated averages of the 'instantaneous' metabolic rate of the animal over time.   This is mostly irrelevant if metabolic rate is constant and you have plenty of time between baseline reference readings, but instantaneous changes (or reference readings) in metabolism produce exponential approaches to the new value, not a step change.   The washout kinetics of the chamber are crucial (along with how well a chamber is mixed) in determining the response time to changes in metabolic rates.

    This window calculates the washout rates of theoretical perfectly-mixed chambers as a function of volume and flow rate.   The computed value is the time for X% of intial gas volume to be replaced -- akin to the 'half-life' concept for radioactive decay and related phenomena.  Note that no real chamber will exactly match these estimates.

  •   Q10 ADJUSTMENT…     This calculates the effect of temperature (Q10) on the rate of reactions or functions -- speed, power, metabolism, etc.   Q10 is the factorial change in rate across a 10 °C temperature change.   
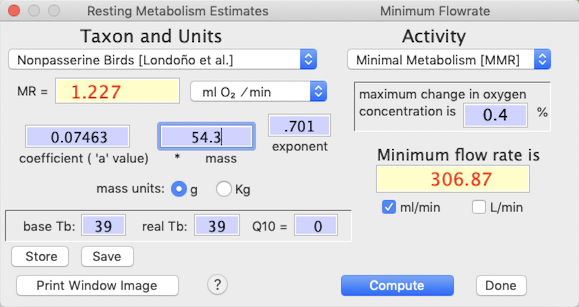
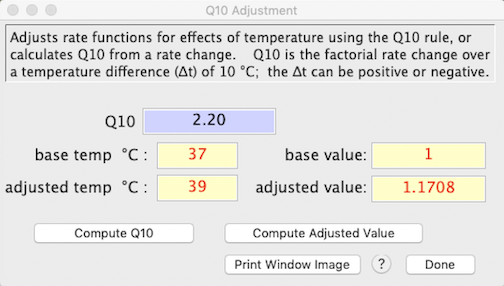
To do that, enter a base temperature and an adjusted temperature, the base value of the rate function, and the Q10 (the default is 2.2), and click the 'compute adjusted value' button.   Alternately, enter the base and adjusted temperatures and the base and adjusted rate values, and compute Q10 by clicking the 'compute Q10. button.   The temperature difference (base temperature to adjusted temperature) can be positive or negative.

    Top of page

  •    CLOSED SYSTEM RESPIROMETRY...     This calculator computes rates of oxygen consumption (VO2) and/or carbon dioxide production (VCO2) in air or other breathable gas mixture in a closed system (i.e, the animal is sealed in an air-tight chamber for some time and metabolism is computed by the change in concentration of O2 and CO2 between initial and final gas samples). You need to enter:
    • chamber temperature, pressure, and relative humidity (when sealed, not at the end of measurements).

    • chamber volume

    • elapsed time (between taking the initial and final gas samples)

    • initial fractional concentrations of O2 (FiO2) and CO2 (FiCO2)

    • the change in concentration (in percent) of oxygen and/or CO2, and the respiratory quotient (RQ)

    If you measure only one of these two gas species, the program will use RQ to estimate the other. If you measure both O2 and CO2 concentration changes, the program will optionally use O2 in the calculation of VCO2. NOTE: it is assumed that sample gas is dried before measurement, and the default settings are:

    • Initial O2 concentration (FiO2) = .2095
    • Initial CO2 concentration (FiCO2) = .0004
    • CO2 is absorbed prior to O2 measurement
    • VCO2 is computed from VO2, if oxygen is measured, or from RQ otherwise

    Equations notes:
    • STP = standard temperature and pressure (0°C, 760 torr)
    • Δ[O2] = fractional change in O2 concentration
    • Δ[CO2] = fractional change in CO2 concentration
    • FeO2 = FiO2 - Δ[O2]
    • FeCO2 = FiCO2 + Δ[CO2]
    VO2 equations:
    • CO2 is absorbed: VO2 = STP volume * Δ[O2] /(1 - FeO2)
    • CO2 NOT absorbed, compute from Δ[CO2]: VO2 = STP volume * (Δ[O2] - (FeO2 * Δ[CO2])/(1 - FeO2)
    • CO2 NOT absorbed, compute from RQ: VO2 = STP volume * (Δ[O2] /(1 - FeO2 * (1-RQ))
    VCO2 equations: NOTE: at typical Δ[CO2], different equations have little effect on calculated VCO2
    • from RQ: VCO2 = STP volume * Δ[CO2]/(1 - FeCO2 * (1-(1/RQ)))
    • from VO2: VCO2 = STP volume * (Δ[CO2] - (FeCO2 * VO2))/(1 - FeCO2)
    Top of page

  •    DAY OF THE YEAR...     This simple calculator will provide the Julian date (days since December 31) for a combination of date, month, and year.   It should account for leap years.

  •    SUNRISE, SUNSET...     This utility uses the well-known ‘Sunrise equation’ to compute the approximate times of sunrise and sunset from date (month, day, year) and location (degrees latitude and longitude).   You need to select North or South latitude, and East or West longitude relative to the Prime Meridian.
             NOTE: The program expects latitude and longitude in fractional degrees, not degrees and minutes. Thus 27° 30’ north should be entered as ’27.5’ (i.e., halfway between 27° N and 28° N).

    Sun time estimates are approximate for several reasons:

    •   Sunrise and sunset times are based on local solar noon (i.e., when the sun is at its zenith (highest above the horizon) from the perspective of the observer’s position.   This is likely to be slightly different from local time.   As defined by people, time zones are arbitrary, and since they are roughly 15 ° of longitude wide and often do not run strictly north and south, sunrise and sunset times can vary by an hour or more with a single time zone.

    •   The calculator has no allowance for elevation above sea level (which makes rise times earlier and set times later, if the horizon is at sea level).   It also has no allowance for local topography — for example, if the observer is in a deep valley, the visual horizon is elevated above the ‘real’ horizon, and rise times will be later and set times will be earlier than shown here.

    •   The precise times of sunrise and sunset are of concern to astronomers and the like, but for most purposes they are rather ‘fuzzy’ due to the angular diameter of the solar disc (about 32 minutes of arc or 0.53 degrees), atmospheric refraction, etc.

    NOTE: The U.S. Naval Observatory hosts a web page (USNO Sun and Moon Data) that permits very accurate calculations of solar and lunar data.  It incorporates ‘fixes’ for many of the issues described above, and — if you are connected to the internet — can be accessed with the ‘Naval Observatory Website’ button.

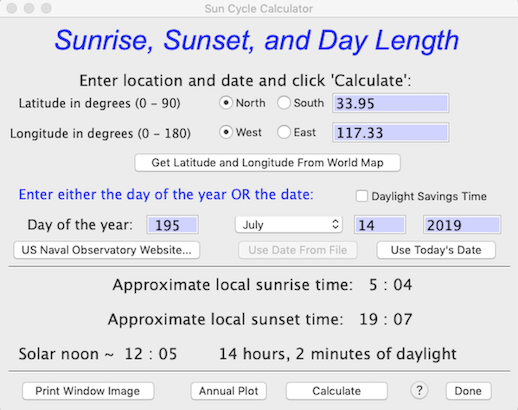
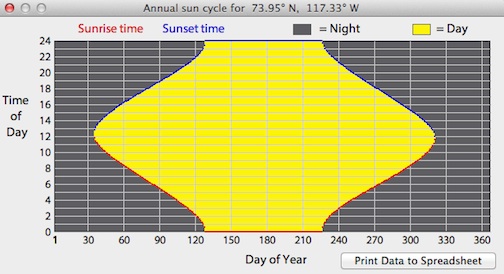
    • The 'Get Latitude and Longitude From World Map' button opens a window with a world map (d'oh!) in Mercator projection.   Move the cursor to the desired location and hit either the spacebar or return keys to select that position; as you move the cursor the latitude and longitude boxes at upper left update continuously.   If you want to select a position on a higher-resolution 'regional' map, click the Zoom in X5 button, a rectangular cursor appears; move it until it encloses your area of interest and hit either the spacebar or return keys to enlarge that region.   Then use the cursor and keys to select a position as described above.

    Location data are accurate only to 0.33 degree of longitude and 0.25 degree of latitude on the world map and 0.11 degrees of longitude and latitude on the regional maps, but that should be accurate enough for most sunrise-sunset calculations.

    As geographic references, the maps show the equator (yellow), the Prime or Greenwich Meridian (zero degrees of longitude), the Arctic and Antarctic Circles (~ 66.5 degrees N and S), and the Tropics of Cancer and Capricorn (~ 23.3 degrees N and S). Only a few of these will be visible on the enlarged regional maps.

    Of course, if you want higher-resolution position data (and you are connected to the Internet), use Google Earth.

    • The 'Annual Plot' button will compute and display an entire year's day length cycle, based on latitude-longitude position.   The 'Print Data to Spreadsheet' button makes a tab-delineated .xls spreadsheet containing the annual cycle (date, sunrise time, sunset time, and day length).   This example shows a Polar-region cycle, with complete darkness in winter and 24-hour sunlight in summer:

  •    UNIT CONVERSIONS...     This calculator will convert many commonly-used units into other units. The conversions are arranged by type, selected with the radio buttons on the right of the window. This utility will also estimate certain biophysical and meteorological data. In the example below, solar radiation intensity is estimated as a function of how far the sun is above the horizon.


    go to: