 TIME GRIDS submenu
These submenus control the display of
vertical (time) grid lines: TIME GRIDS submenu
These submenus control the display of
vertical (time) grid lines:
SHOW
TIME GRID Activates or deactivates the display
of time grids and tics in plot areas during data acquisition.
DASHED
GRID LINES Toggles between dashed and solid
grid lines in plot areas. NOTE: this option is deselected unless
SHOW TIME GRIDS is 'on'.
DASHED
MARKER LINES Toggles between normal (dashed)
and solid marker lines in plot areas. During chart file acquisition,
markers appear when individual keys are pressed.
SCALE GRIDS submenu
These submenus control the display of
horizontal (scale) grid lines:
SHOW
SCALE GRID Activates or deactivates the display
of time grids and tics in plot areas during data acquisition.
MANY
GRID LINES Toggles between normal and high-density
grid lines in plot areas. NOTE: this option is deselected unless
SHOW TIME GRIDS is 'on'.
SHOW
ZERO LINES Toggles between visible and hidden
zero lines in plot areas. These indicate the position of zero, if
the data range includes zero.
RECORDING WINDOW SIZE On
a large screen, these submenus allows use of several window sizes:
SET
WINDOW AREA This option (only available if
the screen is bigger than 640 X 480 pixels -- as is true in all modern
computers) lets you set the display window size by dragging a window to
the desired shape. It will not allow a display size smaller than 640 X
480 pixels, and the window is always in the upper left corner of the screen.
640
X 480, 800 X 600, 832 X 624, 1024 X 768 Sets
the display window size to a specified number of pixels, in the upper left
corner of the screen.
FILL
SCREEN Sets the display window size to fill
the available screen area (no part of the desktop is visible when gathering
data).
Top of page
PLOT
HEIGHT (not accessible in Multichannel Oscilloscope
mode) allows you to divide up the vertical screen area among the different channels
according to your own preferences. For example, you can show some
channels in large vertical scale and others in much smaller scale.
Note that because there is a fixed amount of screen space available, making
a channel larger than normal requires shrinkage of other channels:
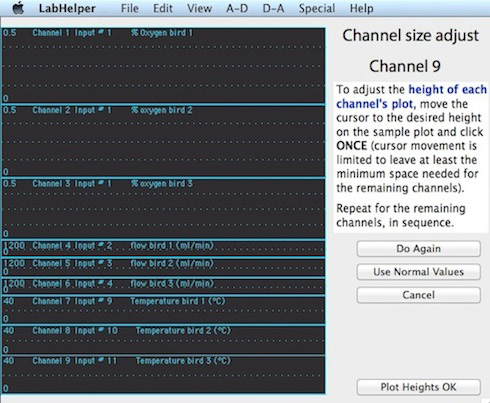
To set channel heights, move the cursor up and down within the simulated plot area
until it is at the desired height, then click. The program steps through
the channels in sequence. When all channels are complete, you can
accept the results, use normal values (all channels with equal heights),
or redo the selection.
The program tries to reserve a minimum amount
of space for any remaining channels (20 pixels high), but slightly more space will be needed if you are using alarms or device switching (the notification textfields for these occupy more than 20 pixels of vertical space). Channel heights
do not affect other aspects of the data acquisition process.
CHART VIEWS AND TICS... ⌘G opens a window that allows
selection of the 'density' of data plotted in chart mode and, if the maximum number of samples exceeds the width of the DAQ window, the method of scrolling data:
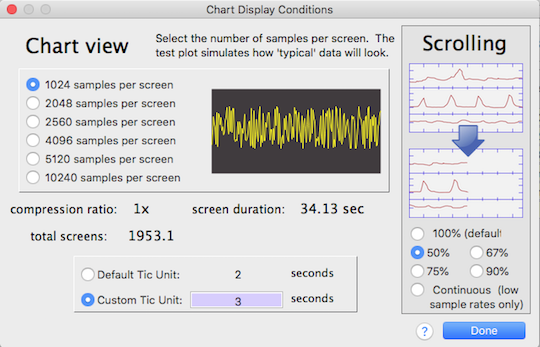
The normal view contains one sample per pixel on the x-axis. However,
you can select compression ratios of 2, 2.5, 4, 5, and 10 (these options
are available only if the number of chart samples is greater than the number
of samples per screen). Thus with a 640-pixel-wide screen, up to 6400
samples can be shown on a single screen. The range is 832 - 8320
when using an 832 pixel-wide screen, and so forth with larger screen sizes.
Using the more compressed views increases the amount of recording time
that fits on the screen, but at the same time the screen resolution is decreased
(for viewing only; not recording) because several samples are plotted within
the same x-axis pixel position.
Some combinations of view compression and maximum sample number may generate
fractional time units on the X-axis of the chart display. However,
you can manually adjust the scaling of the 'time tics' on the x-axis (if
they are used) with the 'use custom tic unit' button (this is automatically
selected if you click in the adjacent edit field).
If the number of samples is greater than can be shown on a single DAQ window,
the chart display must be scrolled when the data plot reaches the
window's right edge. The default scrolling value is 100% -- that is,
the entire window is redrawn, showing none of the previously-acquired data.
Alternately you may select fractional scrolling (50%, 67%, 75%, or 90%), which
leaves some of the previously-acquired data in view.
Another option, which works only at low sample rates, is 'Continuous' scrolling. In this mode, once data lines reach the right edge of the DAQ window, the window is scrolled one pixel at a time as additional data are obtained. If you sample too fast, data will be acquired -- and can be saved --successfully, but the display updating will 'get behind' and seem to pile up at the right edge: display updating will lag behind data acquisition. The program will let you do this but it may be cosmetically ugly and confusing as well. The sampling rates that cause this problem depend on the number of channels, the speed of the computer's graphics engine, and other factors, but very roughly, you can expect normal function with 6-10 channels if sampling rates are slower than 2-4 samples/sec.
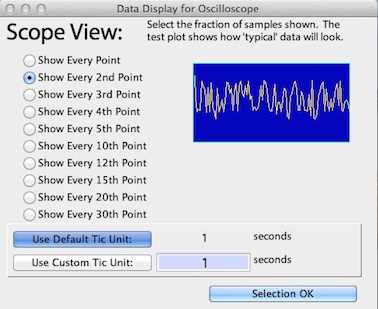 SCOPE
VIEWS AND TICS... opens a window that allows
selection of the 'density' of data plotted in chart mode. It is similar
to Chart view, except that it offers options to display only a fraction
of the gathered data (all the data will be saved if a file is stored). Reducing the number of points displayed
can greatly increase the display rate (and hence the fraction of total time
spent in sampling data) -- although this is rarely a limitation with fast, modern Macs and relatively slow A-D converters. For all practical purposes, you should use the "show
every point" option.
SCOPE
VIEWS AND TICS... opens a window that allows
selection of the 'density' of data plotted in chart mode. It is similar
to Chart view, except that it offers options to display only a fraction
of the gathered data (all the data will be saved if a file is stored). Reducing the number of points displayed
can greatly increase the display rate (and hence the fraction of total time
spent in sampling data) -- although this is rarely a limitation with fast, modern Macs and relatively slow A-D converters. For all practical purposes, you should use the "show
every point" option.
LARGE READOUTS In addition
to the graphical display, LabHelper shows digital readouts of channel
values during data acquisition. The LARGE READOUTS option toggles
between the normal size digital readout displays (in 10-point type) and
a much larger display (in 20-point boldface) that is more easily visible
from a distance. Note that if you have selected a very small plot
height for a particular channel, a large-format digital readout may not
fit or may block views of the graphical data display.
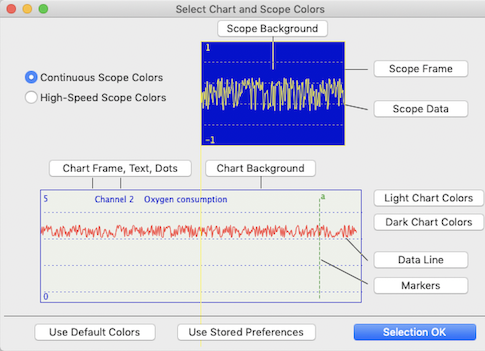 PLOT STYLES This window lets you select colors for chart and
oscilloscope screens from the standard Mac color wheel. Obviously,
this option is not available on monochrome monitors, but gray scale is an option. Two default color sets for chart mode recordings ('Light Chart Colors' and 'Dark Chart Colors') can be selected via buttons; this example shows Light Colors. Color preferences
can be saved for automatic re-use the next time the program is launched
(use the SAVE PREFERENCES menu selection).
PLOT STYLES This window lets you select colors for chart and
oscilloscope screens from the standard Mac color wheel. Obviously,
this option is not available on monochrome monitors, but gray scale is an option. Two default color sets for chart mode recordings ('Light Chart Colors' and 'Dark Chart Colors') can be selected via buttons; this example shows Light Colors. Color preferences
can be saved for automatic re-use the next time the program is launched
(use the SAVE PREFERENCES menu selection).
Top of page
STATUS
DISPLAYS At most sampling rates, LabHelper
provides several status displays on the data acquisition screen. These include the numeric variable value readouts in chart channel panels. Updating these during acquisition requires some cpu and display time, and they occupy some screen space, so they should be turned off when you want to use very high sampling rates. 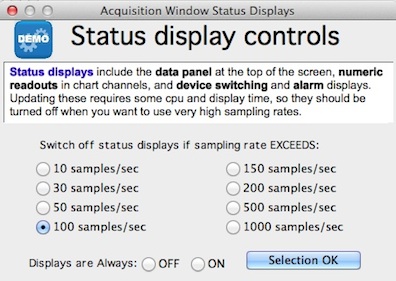 In practice, this often has only a minor effect because the biggest constraint on sampling rate is the speed of the A-D converter, and how fast data can be transferred over the serial interface linking the converter to the computer. However, if the DAQ window is wide (e.g., >1200 pixels), the number of channels is large, and the sampling rate is high, turning off channel status readouts can make the graphical display update more smoothly. It might also be useful to switch status displays off if you want a 'cleaner' picture of the graphical display of DAQ results.
Use this window to adjust the 'cutoff' sampling rate above which status
displays are switched off (you can also instruct LabHelper to leave
them on or off at all speeds).
SHOW
SWITCH STATUS Activates or deactivates a display
of the external device control status during data acquisition. This
shows whether a particular channel's device is acquiring sample data, reference
data, or is inactivated (zeroed).
Top of page
SIGNIFICANT DIGITS Lets you select the number of significant digits in numeric displays (this has no effect on the precision of recorded data).
Top of page
|
