SPIKE FILTER This option uses a sample-comparison algorithm to attempt to find and remove 'spikes' as data are acquired. 'Spikes' are single-point (i.e., one sample) aberrant readings that may represent electrical noise or some other instrumentation fault instead of real data. 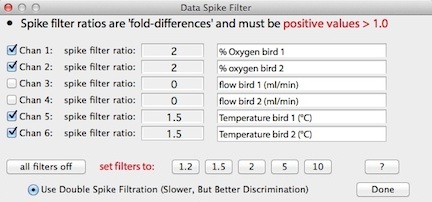 The spike filter compares the current data value for a given channel with the previous value for that channel. If the current value is sufficiently different from the previous value, it is resampled (resampled twice if you select the 'use double filtration' option), and the two 'new' samples are compared with the previous sample to determine which is aberrant. Obviously it can't function for the first few data points in a recording (since it doesn't have any previous values for comparison).
The 'difference' between current and previous readings is computed as a ratio, or fold-difference factor (e.g., 2X larger or smaller than previous data). A ratio of 1.1 means that a reading 10% or more different from the mean of the two previous values is interpreted as a spike. You can set the fold-factor in the edit field; only positive values greater than 1.0 are acceptable. Larger fold-factors increase the factorial change between successive readings that will be accepted as valid data. After recording is stopped, a report of the number of spikes removed is saved in the file comments.
NOTES:
- The spike filter tests raw input values (voltage, resistance, etc.), not the final values after conversion factors have been applied.
- Spike filtration is a compromise between sampling speed and spike discrimination ability. The 'use double filtration' option will improve the algorithm's ability to find and discard spikes, but can slow sampling when sample rates are high.
- The fold-factor should be determined from the noise level in the system and the necessary accuracy and speed.
- The spike filter is not perfect and may sometimes reject valid data, especially when input data are close to zero and have some variance. Therefore it should be used with care, and only for data containing considerable noise. Note that the spike filter does not function for data read as text from a serial-stream input.
AUDIBLE
EVENT TIMER This option lets you use audible
cues to time external events. For example, if you need to perform
a timed experimental manipulation and you do not want to look at a clock
or watch, the program will provide you with an aural cue on a preset schedule.
You can adjust each sound (several spoken words, recorded from my "dulcet" (ahem...)
voice, along with some standard computer sounds), when it occurs (in relation
to elapsed time or elapsed samples), and when it starts and stops.
These settings are saved in 'setup' files.
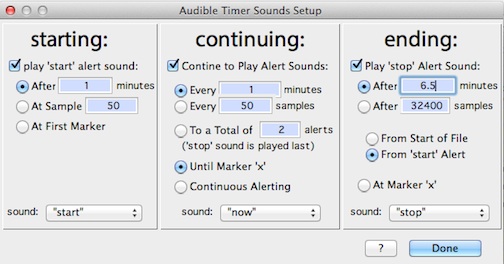
In this example, audible timing will commence with the spoken word "start"
when the first marker is struck. The alert "now" will sound
every minute for 6.5 minutes, at which point the "stop" sound
will occur.
The BEEP AT SAMPLE option toggles an audible signal (a quiet 'peep' sound)
when a sample is recorded. This item is available if the sample rate
is slower than 10 samples/second, and for the most part is really only useful
for semple intervals of several seconds.
SET
ALARMS... ⌘W Opens a window
(shown in the following example) that allows you to set up the alarm status
for each channel. An alarm is triggered whenever the input to that
channel violates certain conditions -- some fixed, some user-specified.
If alarms are set, warnings of alarm conditions appear in the upper right
corner of chart output during data gathering. Optionally, an audible
buzzer can be triggered by an alarm condition. Finally, a summary
of alarms can be called up from the Options
window at the end of a data run. Note that alarms do not function
with oscilloscope channels.

Three types of alarms are possible:
- Overrange (over-voltage) alarms are triggered when the input
voltage exceeds the capacity of the A-D converter in use (plus or minus
5 or 5.12 volts with the Sable UI2 or UI3, or
plus or minus 3.5 volts with current DataTakers, etc.). Optionally, the
computer will sound an audible alarm when it encounters an overrange condition
(note that this will slow acquisition when sampling at high rates).
- Upper limit alarms occur whenever values (after conversion,
NOT input volts) exceed a user-set limit.
- Lower limit alarms occur whenever values (after conversion,
NOT input volts) fall below a user-set limit.
Note that using alarms can slow the maximum possible sampling rate.
However, for most sampling rates, use of alarms has no effect on performance.
AUTOREPEAT
or AUTOMARKERS... This selection depends
on the recording mode in use:
In chart mode, the Autorepeat option allows LabHelper
to automatically save data when the maximum number of samples has been
recorded, and then automatically restart data gathering. If this
option is selected, a standard Mac file opening dialog will appear, requesting
a file root name. Saved files will have a name consisting of the
root (e.g., 'bird data') plus a suffix corresponding to the sequence number
(e.g., 'bird data 1', then 'bird data 2', then 'bird data 3', etc.) of
the file.
| WARNING: if you selected
a large number of samples, be sure you have plenty of disk space available
to save the expected number of files! |
After the file root is selected, LabHelper presents a window
for entering a comment string and data for gas exchange calculations (body
mass, flow rate, barometric pressure, etc.).
In scope + chart mode, the Automarkers option will place
a marker in the chart channels whenever a scope file is saved with the
'tab' key. These markers start with 0 and increment to 9,
and then repeat.
CUT
CHANNELS... ⌘K Opens a window that lets you selectively
remove channels. This is only available if at least two chart channels
are available (it will not let you reduce the number of chart or scope channels
to zero).
ADD
A CHANNEL... Adds a single channel to the current
acquisition setup. This menu is available only in certain conditions:
- chart or scope plus chart mode
- accessible from the Show Setup
or Options windows only
- there must be less than the maximum number of channels selected (<16
in chart mode, <5 in scope plus chart mode)
This selection opens a series of windows that request the A-D input, conversions,
scaling, etc..
2 - CHANNEL X-Y PLOTS... This option lets you view a real-time
scatterplot display of interactions between any two channels as data are
being acquired. The interaction is shown as a bicoordinate plot of the corresponding
values, with one data channel used for the X-axis and one channel for the
Y-axis. A small window appears at the upper right of the main plot area,
with data shown as yellow dots (one per sample) on a red background. The
axes are scaled the same as they are for the corresponding channels in the
main data display (you can change this scaling from the Show
Setup window).
If you are trying to sample very rapidly, an X-Y plot will slightly slow
the maximum sample rate, but for most sample protocols it will make little
or no difference.
During a run, you can press the 'option-c' key
combination to clear the X-Y plot screen of data.
NOTE: The X-Y plot window will not
open if there is insufficient space between the right edge of the main data
plot and the right edge of the screen. At least 100 'spare' horizontal pixels
are needed; more will be used (up to about 300) if available. Use the '
Set Window Area' option in the VIEW
menu to select a smaller plot area, if necessary (this will be difficult
to accomplish on a small screen, and the X-Y plot option is not available
on a low-resolution 640 X 480 pixel screen).
EXTRA ZERO LINKAGES... Zero linking is an option for periodic references, when one external device switches two logical channels. In this situation it is useful for the second channel to record zero when not 'connected' to the switched instrument. Zeroing helps to avoid confusion during analysis -- it's less likely that an incorrect assignment of data to animal will occur (the 'primary' channel automatically records zero when not 'connected').
To 'link' another channel to a primary channel, click the appropriate button to the right of the primary channel's label; when everything is appropriate, click the 'OK' button.
|

 These submenus allow you to change one channel's voltage conversion and labeling
from the regular
These submenus allow you to change one channel's voltage conversion and labeling
from the regular