After LabHelper has 'looped'
through all the selected channels, or if you loaded a setup file from the
initial Mode window, the DISPLAY
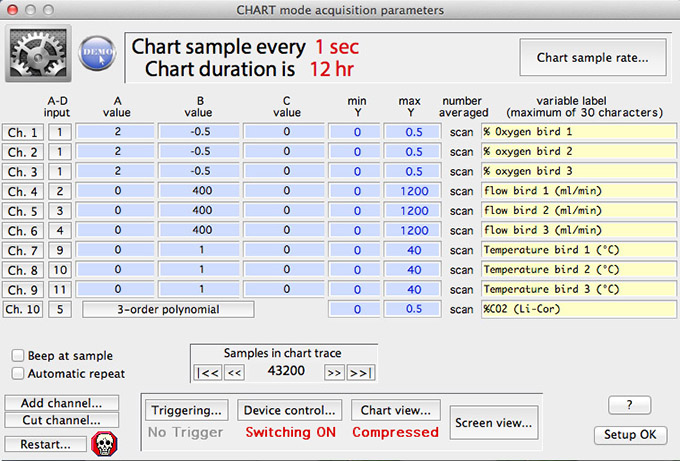
SETUP window appears. This shows a summary of the data acquisition
parameters for each selected channel (the physical A to D input, the A,
B, and C (exponent if power function) values for voltage conversion, the
Y-axis scaling, the number of readings averaged, and the channel label).
To alter any of these parameters, click the cursor in the appropriate edit
field and change the parameter as desired. Here is an example for
Chart mode, showing ten input channels:
NOTE: earlier versions used somewhat different color schemes and have edit fields instead of buttons for A-D inputs, but the function is very similar.
- In Oscilloscope and Oscilloscope plus Chart mode, some
edit fields are 'fixed' and cannot be changed. These have
a dark gray background.
- Note that a channel used for the keyboard event recorder must have
an A value of -9999. The B and C values are not used.
- If you are using a 3-degree polynomial conversion for a channel,
the A, B, and C values for that channel will be replaced by a button labeled
'3-order polynomial', as seen here for channel 10. Click this to change
the polynomial variables, the factor used to convert input volts to millivolts,
and the "scaling" factor to be applied to the result.
In Chart
mode, the default averaging mode is continuous repeated readings until the
time of the next sample ("Continuous averaging"
mode), and the 'number averaged' fields read 'scan'.
Top of page
The
CONVERSIONS menu is accessible. This allows you to use the
regular voltage Conversions window to
adjust the voltage conversion parameters on each channel (except for oscilloscope
channels, which read raw input voltage only). You can also access
the set alarms window to configure an appropriate alarm setup (see
the MENU section for details).
To test
the voltage conversion and display parameters for any channel, click the
appropriate "Chan. #" button in the leftmost column.
A window will open showing a scrolling display of the current input values
on the selected channel:
This will allow you to adjust any voltage offsets, gains, etc.
before starting a data acquisition run. You can switch between fast and
slow updating by pushing the 's' key (slow updating is often more
readable), and you can adjust the number of averaged samples with the 'n'
key. In this example, sampling began at a low averaging number (4) and
then the user raised the averaging number to 150 -- resulting in a much
'smoother' plot.
Top of page
In Chart
mode, Scope plus Chart mode, or Multichannel Oscilloscope mode,
you can add or delete channels with buttons in the lower left corner.
This example shows three channels being removed from an 8-channel setup:
You cannot add beyond 16 channels in Chart mode (5 in Scope
plus Chart mode), and you cannot cut to less than 1 channel in Chart
mode (2 in Scope plus Chart mode).
You
may also change the sample interval (both
the oscilloscope and chart channel intervals can be changed if you are in
Oscilloscope plus Chart mode), the control of external
devices, set up triggering, or
restart LabHelper from scratch (this is useful if you want to load
a setup file, or change the recording mode).
Top of page
The
button called 'Chart View' opens a window that allows selection of
the 'density' of data plotted in chart mode:
The normal view contains
one sample per pixel on the x-axis. However, you can select compression
ratios of 2, 2.5, 4, 5, and 10 (these options are available only if the
number of chart samples is greater than the number of samples per screen).
Thus with a 640-pixel-wide screen, up to 6400 samples can be shown on a
single screen. The range is 832 - 8320 when using an 832 pixel-wide
screen, and so forth with larger screen sizes.
Using the more compressed views increases the amount of recording time
that fits on the screen, but at the same time the screen resolution is decreased
(for viewing only; not recording) because several samples are plotted within
the same x-axis pixel position.
Some combinations of view compression and maximum sample number may generate
fractional time units on the X-axis of the chart display. However,
you can manually adjust the scaling of the 'time tics' on the x-axis (if
they are used) with the 'use custom tic unit' button.
If the number of samples is greater than can be shown on a single screen,
the chart display must be scrolled when the data plot reaches the
screen's right edge. The default scrolling value is 100% -- that is,
the entire screen is redrawn, showing none of the previously-acquired data.
Alternately you may select fractional scrolling (50%, 67%, or 75%), which
leaves some of the previously-acquired data in view.
The
button called 'Scope View' opens a window that allows selection of
the 'density' of data plotted in chart mode. It is similar to Chart
View, except that it offers options to show only a fraction of the gathered
data (all will be saved if a file is stored). This can greatly increase
the display rate (and hence the fraction of total time spent in sampling
data). Note that you should use the "show every point"
option UNLESS you don't need to see every display point:
Top of page
A button called 'Plot Height' allows you to
divide the screen up among the different channels according to your own
preferences. For example, you can show some channels in large vertical
scale and others in much smaller scale. Note that because there is
a fixed amount of screen space available, making a channel larger than normal
requires shrinkage of other channels:
To set channel heights, move the cursor within the simulated plot area
until it is at the desired height, then click. The program steps through
the channels in sequence. When all channels are complete, you can
accept the results, use normal values (all channels with equal heights),
or redo the selection. The program always reserves a minimum amount
of space for any remaining channels (20 pixels high). Channel heights
do not affect other aspects of the data acquisition process.
Top of page
At the bottom of the DISPLAY
SETUP screen are buttons to select:
The
maximum number of samples to be gathered in chart mode before LabHelper
stops to save the recorded information on disk (up to two million). The
value can be incremented in units of screenwidth pixels. These
buttons are not available when in Oscilloscope mode.
The
number of samples in a scope screen (in Oscilloscope, Oscilloscope plus
Chart, or Multichannel Oscilloscope mode). The choices are 640 up
to 65,500 (depending on the size of the screen). The value can be
incremented in units of 640, 832, etc. depending on screen width.
These buttons are not available when in Chart mode.
Whether
or not the computer beeps at each sample (not available in Oscilloscope
mode, or at high sampling rates in other modes).
The
AUTOREPEAT option. Autorepeat (available in Chart mode
only) allows LabHelper to automatically save data when the maximum
number of samples has been recorded, and then automatically restart data
gathering. If this option is selected, a standard Mac file opening
dialog will appear, requesting a file root name. Saved files will
have a name consisting of the root (e.g., 'bird data') plus a suffix corresponding
to the sequence number (e.g., 'bird data 1', then 'bird data 2', then 'bird
data 3', etc.) of the file.
WARNING: if you selected
a large number of samples, be sure you have plenty of disk space available
to save the expected number of files! |
After the file root is selected, LabHelper presents a window for
entering a comment string and data for gas exchange calculations (body mass,
flow rate, barometric pressure, etc.).
If you are in Oscilloscope plus Chart mode, a button for Automatic
markers is displayed at the bottom left of the screen. If this
button is ON, LabHelper will insert a marker into the chart files
whenever an oscilloscope screen is saved. These markers are a sequence
of numbers from 0 to 9, which repeats up to a total of several thousand markers.
You can also enter markers manually by pushing any letter or number key.
Edit
these values as necessary (or ignore them if they are not relevant), then
click the 'Setup OK' button.
|