| |
Chart and Scope Views
|
|
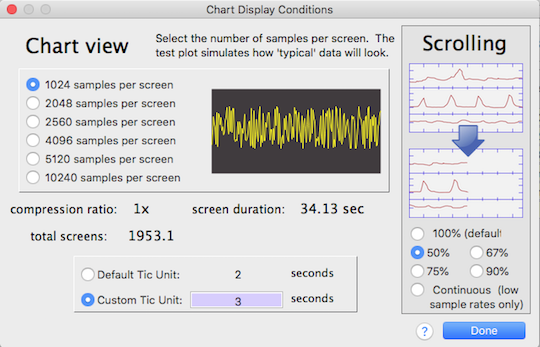
The normal view contains one sample per pixel on the x-axis. However, you can select compression ratios of 2, 2.5, 4, 5, and 10 (these options are available only if the number of chart samples is greater than the number of samples per screen). Thus with a 640-pixel-wide screen, up to 6400 samples can be shown on a single screen. The range is 832 - 8320 when using an 832 pixel-wide screen, and so forth with larger screen sizes. Using the more compressed views increases the amount of recording time that fits on the screen, but at the same time the screen resolution is decreased (for viewing only; not recording) because several samples are plotted within the same x-axis pixel position. Some combinations of view compression and maximum sample number may generate fractional time units on the X-axis of the chart display. However, you can manually adjust the scaling of the 'time tics' on the x-axis (if they are used) with the 'use custom tic unit' button (this is automatically selected if you click in the adjacent edit field). If the number of samples is greater than can be shown on a single DAQ window,
the chart display must be scrolled when the data plot reaches the
window's right edge. The default scrolling value is 100% -- that is,
the entire window is redrawn, showing none of the previously-acquired data.
Alternately you may select fractional scrolling (50%, 67%, 75%, or 90%), which
leaves some of the previously-acquired data in view. 
|
| Other links: |