|
LabHelper's screen display during data acquisition varies with
operational mode and the number of channels. Users can vary the colors
of the screen stripcharts (from the Plot style option of the 'VIEW' menu).
The following discussion refers to the "standard"
colors specified in the standard 'LabHelper prefs' file, and may not
be the ones the user prefers.
Keyboard language differences: The key (letter) commands described below are based on a US ENGLISH keyboard. If you use a keyboard for another language, you may find that some of the key letter commands don't work or give unexpected results. This should not be a serious issue as all of the key commands can be performed from menus or the 'toolbar' that appears during recording. If you do want to use key commands, trial and error experimentation will reveal which keys on your keyboard correspond to particular commands.
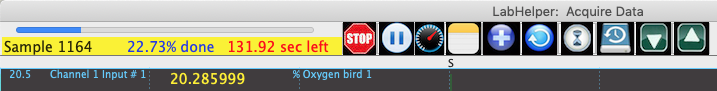
A typical CHART
mode plot window is shown here (in the default colors):

The plot areas (1 to a maximum of 16) are dark gray,
with blue grid lines and lettering. Data are plotted as yellow
lines extending left to right across the screen. The information shown
in the plot areas and the data bar varies with sampling rate. At high
sampling rates, the yellow data bar at the top left of the screen shows
only the sample number and the maximum number of cases. At slower
sampling rates, it shows the sample number, time, percent
completion, and time remaining. If Autorepeat
is selected, a small window in the first channel's plot area shows the current
file name under which data will be stored. Except at high sampling
rates, channel values (the last value recorded for each channel) appear
in the plot area(s); this is under user control. At the bottom of
the plot area are tics showing an elapsed time scale. If one of the
external device control modes is operating, a yellow-on-blue legend reading
" '-' for ref, '+' for sample " appears in the lower part of the
screen below the plot areas. In this example:
- 3 markers ("a", "b", and "c") have been
entered
- channels 1 and 3 are interfaced to external switching devices (both
show periods of 'zero' value, indicating when they were not being recorded)
NOTE: If you are using a high sampling rate, and have a wide plot window, and are reading numerous channels, the data line updating may seem 'jerky' or irregular, especially towards the right edge of the plot window. This is due to the way MacOS and LabHelper draw graphical data to the screen. The 'jerky' plotting DOES NOT indicate errors in sampling rate: the A-D converter is being read at a steady rate. Only the screen drawing appears irregular.
|
If you are using a 'compressed' view mode (selected with the chart view button on the Display Setup window),
the degree of view compression is shown in the lower left corner.
Top of page
If your screen is wider than 640 pixels, a small yellow window showing
the backup status appears in the lower right corner.
| The Toolbar lets you control acquisition by clicking icons instead of using the keyboard (both options work). You can select either a white or dark toolbar in the 'Preferences' option in the 'LabHelper' menu. The icons should be mostly self-explanatory.
NOTE: At high sampling rates with some A-D converters, responses to toolbar clicks may be slow, or missed. This is because the program is spending most of its time reading data, not checking the toolbar. The solution is to click and hold the mouse button down for a second or so (or until the response you want occurs).
- The red 'STOP' button halts acquisition and opens the Options window (same as hitting the ESC key).
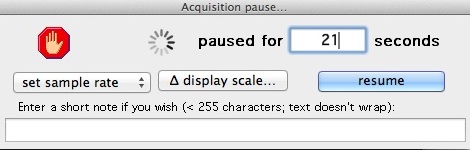
- The '||' button pauses acquisition and opens a window that lets you adjust channel scaling or sample rate. You can write a short note if you wish; this will appear in the file's comments. Acquisition is halted while this window is open:
- The 'speedometer' button (optional; set in Preferences) shows an estimate of the sampling rate and will warn if it is slower than the requested rate. The window closes automatically after a few seconds.
- The 'notepad' button lets you enter a note of up to 250 characters in real time (during acquisition); the note(s) can be read when the file is analyzed in LabAnalyst and are aligned to the time at which the note was written, with a marker in the file. You can edit your text only with the backspace/delete key; clicking the cursor doesn't work. Also, this process may slow sampling if you are acquiring data at high speed:

- The '+' button adds time (same as hitting the 'Return' key) -- up to the maximum sample number of 2 million.
- The 'circling arrow' button opens a window that plays back the entire set of acquired data; acquisition continues in the background. Hit the 'resume' icon (triangle) to close this window.
- The 'hourglass' button shows the time remaining until the next reference reading.
- The 'disk + clock' button forces an immediate backup save.
- Finally, the button with up and down triangles switch between reference (down-pointing triangle) or sample (up-pointing triangle).
|
Top of page
Markers (to indicate events, timing, etc.) are entered
by hitting any letter or number key; they appear as vertical lines on the
plot areas. Markers are stored in the data file and can be displayed
during data analysis.
- If you are coming to the end of a chart record and need to continue
recording, hit the 'return' key, or click the toolbar '+' icon. This will add another screenwidth
of cases to the maximum number of cases (up to the maximum sample size).
This works in both CHART and SCOPE + CHART modes. Note that the '+' icon is not visible if you specified the maximum number of cases before data acquisition started.
In OSCILLOSCOPE
mode standard colors, the single plot area is dark blue, with pale blue grid lines and white
lettering. Data points are in yellow. The data bar shows only
the maximum number of points on the screen. A small window in the
plot area shows the file name and suffix under which the next screenfull
of data will be stored. At the bottom of the screen are instructions
for saving screens of data (hit the TAB key), or exiting to the Options window (hit the ESC key; see below).
At the bottom of the plot area are tics showing an elapsed time scale.
Markers are not allowed in Oscilloscope mode.
Top of page
In OSCILLOSCOPE
PLUS CHART mode, the topmost plot area functions like the regular Oscilloscope
mode, with dark blue plot area, pale blue grid lines, white lettering, and yellow data points (these are the default colors). The plot areas for chart channels
are dark gray, with blue grid lines and lettering, and
yellow data lines. The data bar shows the trace length of the chart
screen, and at slow oscilloscope sampling rates it also shows the number
of points recorded on the chart channels. A small window shows the file name under which the next screenfull
of oscilloscope data will be stored. Channel values do not appear, and markers
appear only in the plot areas for chart channels. Markers can be entered
by hitting any letter or number key. When a scope screen is stored, a tilde (~) marker is shown and a note is generated showing the scope file sequence number and the case and time of saving (the notes,but not the tilde, are visible when the file is opened in LabAnalyst). You can still enter markers manually
by hitting any letter or number key.
The view compression and screen indicators are as described for chart
mode, above.
To store the current oscilloscope screen, hit TAB or the 'scope' toolbar button: 
To enter the Options window (for saving
the chart channels and for other operations), hit ESC (or click the corresponding toolbar button). At the bottom
of the plot area are tics showing an elapsed time scale.
|
