MARKERS
 This submenu has
three items: This submenu has
three items:
SHOW
MARKERS / HIDE MARKERS Toggles the display
of markers in the plot area (if the screen is large enough, there is button
for this in the upper right corner of the plot area).
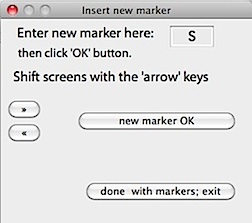 INSERT MARKER(S)
Lets you insert additional markers into a file
(beyond those entered when the data were acquired in LabHelper).
A window opens asking you to pick the letter of the new marker. Having
done that, you move the cursor to the plot area and click on the location
where you want to put the new marker. INSERT MARKER(S)
Lets you insert additional markers into a file
(beyond those entered when the data were acquired in LabHelper).
A window opens asking you to pick the letter of the new marker. Having
done that, you move the cursor to the plot area and click on the location
where you want to put the new marker.
The "»" and "<<"
buttons are for the standard interpolation markers; "»"
indicates the start of a segment of interpolated data and "<<"
marks the end of the segment. These may be used to avoid including interpolated
data in many analysis operations. Interpolation markers are (optionally)
set automatically by the 'REMOVE REFERENCES' and 'SPIKE REMOVAL'
procedures in the EDIT menu, but you
may occasionally need to insert them manually.
When done (or when you want to change the marker letter), go back to
the 'Insert new marker' window.
REMOVE MARKERS IN BLOCK
Eliminates all markers from within a selected block.
GRIDS AND SEGMENTS This submenu has four items:
SHOW GRID LINES Toggles the display
of horizontal grid lines in the plot area.
SHOW ZERO LINES Toggles the display
of a horizontal line showing the value of zero in the plot area (if the data include zero).
SHOW SCREEN SEGMENTS Toggles the display
of vertical lines indicating 'screenwidths' (segments of the data that each contain a number of samples equal to the number of horizontal pixels in the plot area). These lines only appear when in 'entire file' display mode and the file contains more samples that the number of horizontal pixels in the plot area. You can shift between screen segments with the 'slider' at the bottom of the plot, or with the left and right arrow keys.
SHOW TIME SEGMENTS Toggles the display
of vertical lines showing the time of day in hours.
SCALING [ACTIVE CHANNEL] This submenu has five items:
HIGH RESOLUTION
Automatically finds the Y-range of the data and selects Y-axis scaling
equal to the total range plus 5% in either direction.
SCALE TO INCLUDE ZERO
Selects a range that includes zero and the entire
Y-range of data, and sets the tic marks at whole numbers or simple fractions.
If the data are all positive or all negative, the scale will be set to
include at least 110% of the data range, using zero as the minimum or maximum
Y value, respectively.
- If data include both positive and negative values, this is equivalent
to 'NORMAL SCALING'.
NORMAL SCALING
LabAnalyst X's
default scaling protocol. Selects a Y-axis scaling factor that includes
the entire Y-range of the data, with tic marks set at whole numbers or
simple fractions. If data include both positive and negative values,
this is equal to 'SCALE TO ZERO'. If data are all positive
or all negative, 'NORMAL SCALING' may select a smaller scale factor
(i.e., higher resolution).
MANUAL SCALING...
Allows manual selection of minimum and maximum
Y-values for the plot area. This is useful to optimize scaling for
plot regions of particular interest. On may occasions, the automatic
scaling options (NORMAL SCALING and SCALE TO ZERO) do not
show areas of particular interest at sufficiently high resolution.
When the manual scaling window (shown at right) opens, it displays the
current scaling values for the active channel. You can modify them
as desired.
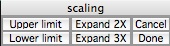 SET INTERACTIVELY... Lets
you use the mouse and cursor in the plot area to set SET INTERACTIVELY... Lets
you use the mouse and cursor in the plot area to set
the scaling limits,
using this small window:
- Click the 'Upper limit' or 'Lower limit'
button, then move the cursor line to the desired spot and click the mouse
once. You can also expand a plot with a too-confining scale by clicking
the 'Expand 2X' or 'Expand 3X' buttons. When done,
click the 'done' or 'cancel' buttons. Clicking the
plot area when the horizontal cursor line is not showing is the
same as clicking the 'done' button.
| When using manual or interactive scaling it's
important to remember that the SAME scaling constraints will apply to all
segments of the channel -- regardless of what data they contain.
Manual scaling is switched off (and Normal
scaling is switched on) whenever a new file is loaded. |
| When you
perform a baseline correction on a manually-scaled channel (either 'regular'
manual scaling or interactive scaling), scaling is automatically
reset to 'HIGH RESOLUTION' mode. This is because the baseline
operation changes the position of the data, so manually-set limits are
frequently completely outside the data range after baseline correction. |
SCALING [ALL CHANNELS] This has a submenu with three items:
HIGH RESOLUTION
SCALE TO INCLUDE ZERO
NORMAL SCALING
 N N
These have the same action as described above,
except that they reset the scaling defaults for all channels (not
just the active channel).
ZOOM IN +
If you have selected a block, you can 'zoom in' on that part of the file, enlarging it until it fills the plot area. This is useful for looking carefully at areas of interest. There is no limit on how big or how small a zoomed block can be.
ZOOM OUT -
If you have a zoomed block, this returns the plot area view to 'entire file' mode (i.e., all of the data are plotted). Note that the initial block selection used to zoom the file is lost when you zoom out.
REDRAW
Redraws the plot area, which is useful if it has
been messed up from previous operations, or if a new channel has been selected.
Any data block is retained when the plot is redrawn.
OVERLAY... L Allows you
to draw other channels in the plot area in addition to the active channel.
Note that Overlay is not available in multi-channel display mode.
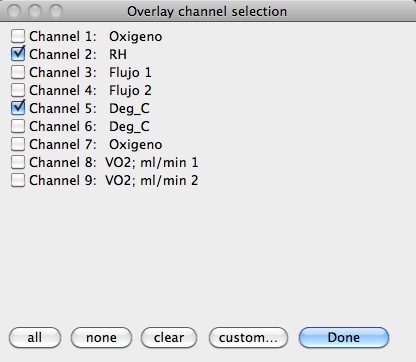
A channel selection window appears in the lower left (the button for
the active channel is switched off). Select any or all of the available
channels, then click the'custom' or 'Done' button.
 If you clicked the 'custom button, you can select two additional options (if you clicked 'done', the program defaults to dashed lines and overlay on all subsequent plots). If you clicked the 'custom button, you can select two additional options (if you clicked 'done', the program defaults to dashed lines and overlay on all subsequent plots).
- Whether the overlay appears only on the present plot area, or whether
all subsequent plot areas (different channels or different screenfulls)
also show overlays. To switch this option off, go to overlay selection
again.
- Whether the lines for overlain channels are drawn as dashes or as solids.
After you click the 'selection OK' button, data about the selected
channels are drawn in colors corresponding to the color code in the lower
left window, and the overlay operation itself begins in the plot area.
- All channels are drawn in black in monochrome mode, which may make
identification of different channels difficult.
An easy way to do a simple overlay (one channel only, no
options for dashed lines or subsequent plotting) is to hold down the command
key while picking the desired overlay channel from the pop-up menu in
the upper right corner of the plot area. This can be repeated as often
as desired for additional channels.
Alternately, you can do a simple overlay by holding down the 'option'
key and selecting the desired channel from the main keyboard number keys
(not the keypad). |
SHOW COMMENTS
Toggles display of the file's comments off or on.
If comments are not shown, the block window is larger and has more vertical
resolution.
Back to top
MULTIPLE CHANNELS...
Allows you to plot any combination of the channels
in the file. There are two 'modes' of channel display: Full Screen
and Plot Area.
- In Full Screen mode, the data plots fill up the entire available
screen area. You can change between the 'entire file' and 'active
screen' modes and shift between screens using the normal channel change
buttons or the left and right arrow keys. You can also send an image
of the file to a printer or load new files, but most analyses and edit
menu functions are not usable. You need to click the close box to
get back to the regular analysis screen.
- In Plot Area mode, the channels are plotted within the normal
plot area and you can use all the normal edit and analysis menu functions.
In either case, a channel selection window allows you to pick any combination
of the available channels. If you click the 'non-standard plot
height' button, a window will open to allow customization of the height
of each channel:
 The window for customized plotting contains a diagram
of the printed page. You select the relative height of each channel
in sequence by moving the cursor on the diagram to the desired height, and
then clicking the mouse ONCE. The channels will be redrawn
one by one as their heights are selected. Note that there is a fixed
amount of room on the screen, so that enlarging one channel requires shrinking
one or more of the others. Consequently, the computer reserves an
amount of space necessary for drawing the remaining channels at the minimum
possible height (and will not let you exceed that limit). You must
select plot heights for all the channels. When done, you can accept
the results, re-do the plot height selection, or revert to the normal setting
(all channels drawn with equal heights). The window for customized plotting contains a diagram
of the printed page. You select the relative height of each channel
in sequence by moving the cursor on the diagram to the desired height, and
then clicking the mouse ONCE. The channels will be redrawn
one by one as their heights are selected. Note that there is a fixed
amount of room on the screen, so that enlarging one channel requires shrinking
one or more of the others. Consequently, the computer reserves an
amount of space necessary for drawing the remaining channels at the minimum
possible height (and will not let you exceed that limit). You must
select plot heights for all the channels. When done, you can accept
the results, re-do the plot height selection, or revert to the normal setting
(all channels drawn with equal heights).
When done, click the 'Plot heights OK' button, and the selected
channels will be drawn.
Example of a multi-channel display with 4 channels out of 6 shown.
These channels are plotted in normal scaling mode.
- NOTE: if the file contains only one channel, the menu reads FULL
SCREEN instead of MULTIPLE CHANNELS.
SINGLE CHANNEL
Shifts back to single channel display. Note that some operations (like
exiting from a full-screen multi-channel display) automatically switch to
single channel display.
COLORS AND LINES... Use this option
to select data line thicknesses and screen color combinations (the latter
option is not accessible or relevant for monochrome displays). In
the example shown below, the user has selected to use the normal line thickness
(1 pixel), and the result is shown in the sample plot area (note that only
the data line is drawn in various thicknesses and only in the plot area;
the block window, overlays, etc. are not affected).
Click the buttons for the various screen components and select colors
from the Apple color wheel. Your selections will affect both plot
and block colors. Block colors in the plot area are the inverse of
the plot colors, and you can't directly control them. However, you
can set the block window color to your preference. You can store your
preferred colors for future use with the Save current preferences option in the LABANALYST menu.
- The Overlay buttons on the right let you select different colors
for each of up to 16 channels; they are shown against the current plot
background color.
- The Histogram bars button allows selection of the bar colors
of histograms, which are used in various analysis modes.
- NOTE: Colors may change if you shift between 8-bit color depth
(256 colors) and greater color depths (16- and 24-bit; 'thousands' or 'millions'
of colors). Modern Macs operate with 'thousands' or 'millions' of colors.
PLOT AS HISTOGRAM H Toggles between plotting data as line
graphs (the LabAnalyst X default) or
as solid 'histograms', as seen in the following example:
Note that the base of the histogram is zero, not the bottom of the plot
area. This means that if the data are all negative, the histogram
will be anchored at the top of the plot area. Some considerations
for histogram display:
- Drawing a plot in histogram mode is slower than drawing
it in line graph mode.
- Only data in the plot area can be drawn as histograms. The block
window always draws line graphs.
- If you use the overlay option,
only the active channel can be shown as a histogram. In many
cases, use of the histogram option makes it easier to see how the other
channels are related to the active channel.
- Many operations (such as interactive spike removal) will temporarily
switch to line graph mode.
- Although it does work, histogram mode is not
recommended if you are sending screen images to a printer (it
wastes a lot of ink or toner).
SHOW ALL CHANNEL VALUES... Provides a continuous numeric readout
of all data channels. As for the data bar, values are updated only
when the cursor is within the plot area. You can either place the
readout box with the cursor or use the default placement (directly under
the value readout of the data bar).
SIGNIFICANT DIGITS
You can choose to show from four to eight significant digits when the
program presents the results of analyses. The default value is six, which is a reasonable approximation of the resolution
and accuracy of most data. Not all of the numbers shown in analysis
windows conform to the user-set number of significant digits (for example,
many mean values are shown with more digits).
| The significant figures setting affects only the display of results.
It does not influence the precision of data
storage or of internal mathematical calculations. |
Back to top
|